Article Text

Statistics from Altmetric.com
One of the most widely used tools for assessing and communicating scientific uncertainty is Grading of Recommendations Assessment, Development, and Evaluation (GRADE), a system for rating the quality of evidence and grading strength of recommendations in healthcare. More than 100 organisations around the world—WHO included1—are using GRADE or have endorsed it.
In GRADE, a quantitative assessment of uncertainty is qualitatively communicated, so that a result obtained as a CI relative to a threshold is expressed as a finding in which assessors have low, moderate or high certainty, or certainty described with other such qualifiers. What these correspond to in quantitative terms, and how decision-makers interpret them, is our issue here. We confine our attention to GRADE’s decision rules for systematic reviews, and do not comment on the problem of multiple outcomes in guideline recommendations.
In a recent guideline article,2 GRADE introduced an idea that appears to undermine sound statistical reasoning in systematic reviews: the idea is that a result that is statistically inconclusive because the null hypothesis cannot be ruled out3 is converted into ‘moderate certainty’. We fear that, applied as a principle, this GRADE guideline may jeopardise patient health.
What is a statistically inconclusive result? Suppose the potential harm of a treatment is tested. A threshold is set above which the harm is clinically relevant. A confidence level is chosen that reflects how the consequences of erroneous inferences are weighted. If the harm is serious, the level may be 99%, with 1% error risk. If the harm is less serious, a 95% or a 90% level might be chosen. Then, if the interval estimate includes the threshold, the possibility of harm cannot be excluded. The result is inconclusive given the research question and given the chosen confidence level. More generally, when a CI includes the clinically relevant threshold, the result is inconclusive3 (p 2596).
GRADE presents as an example a hypothetical case4 concerning the reduction of incidents of ischaemic stroke2 (p 6). The choice of confidence level adopted by GRADE is 95%. The threshold of minimally relevant reduction is set at 1.0% absolute reduction in strokes to reflect the harm associated with the treatment. The resulting interval estimate is 0.6%–2.0%. This means that the threshold is clearly included in the GRADE example. Notwithstanding this, the conclusion of the Grade Working Group (p 7) is the following:
Because the point estimate of 1.3% meets the threshold criterion… the imprecision-generated uncertainty will result in… moderate certainty that the [‘true’] effect is above the threshold [1.0].
In effect, GRADE is downplaying the importance of a prespecified α-level in a protocol by applying the idea that any null hypothesis (threshold) will be rejected to some degree, provided that the point estimate lies on the preferred side of the null hypothesis. This flexibility might be appreciated by guideline developers as well as by stakeholders, but it may also undermine the transparency of the process of the systematic review.
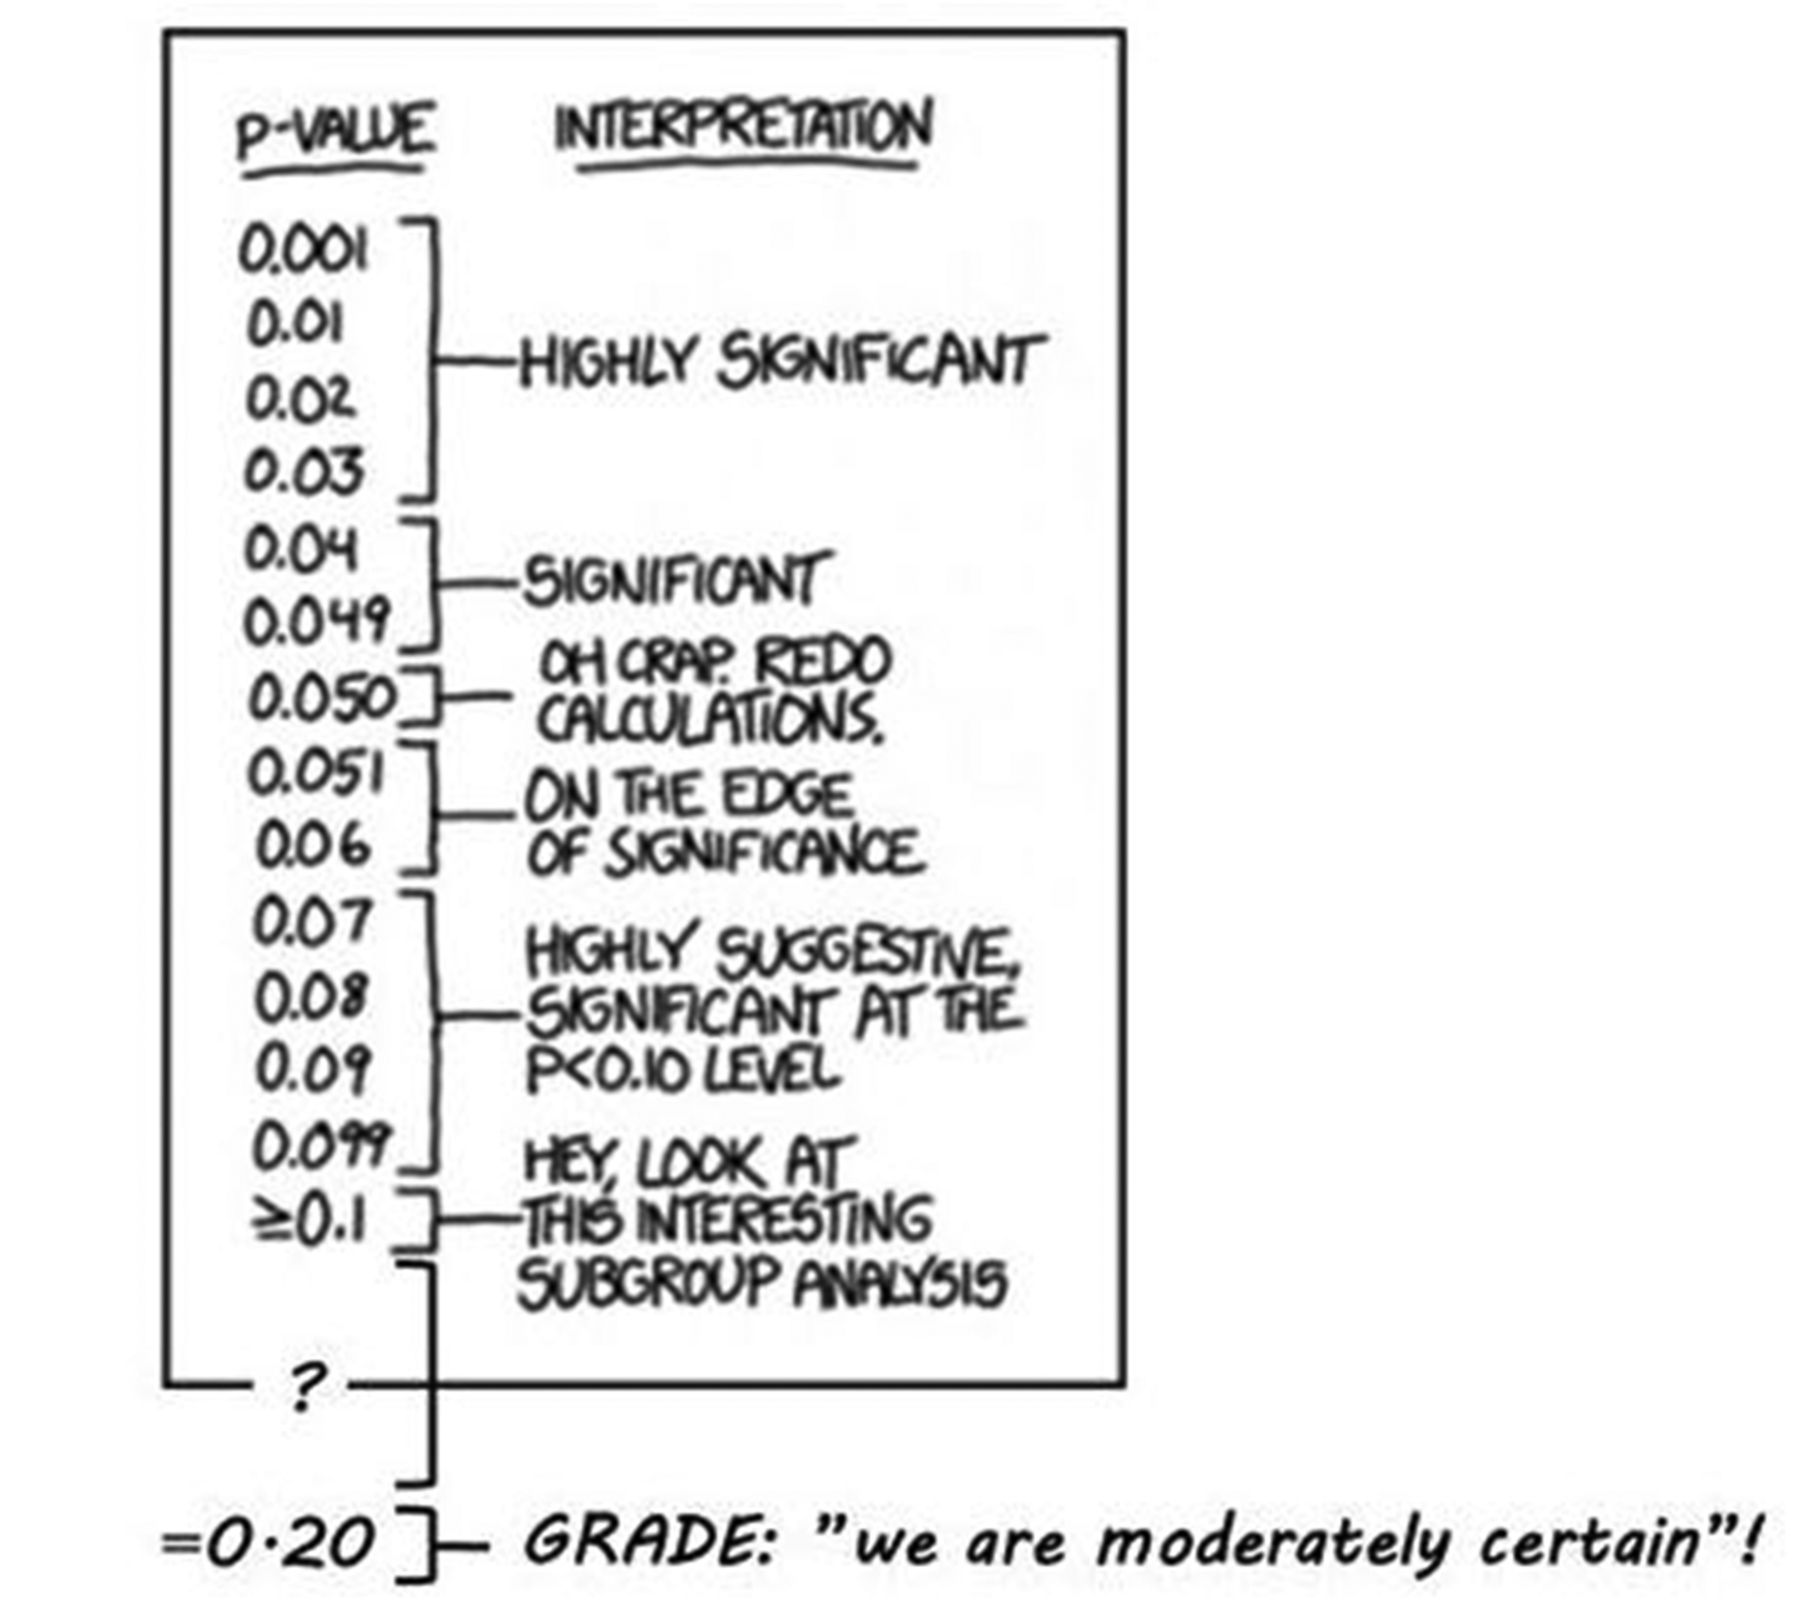
This means that ‘inconclusive’ is converted into ‘moderate certainty’ when GRADE is used. For this specific result to be conclusive, the confidence level must be lowered to less than 80%.i The corresponding p value ii is 0.20 in a one-sided test and 0.40 in a two-sided test. GRADE’s latest stipulation of the meaning of ‘moderate’5 is that the ‘true effect is likely to be close to the estimate of the effect, but there is a possibility that it is substantially different’ (p 404). However, in everyday language a common understanding of ‘moderate’ is ‘within reasonable limits’. If the idea of converting statistically inconclusive results into ‘moderate certainty’ is understood as a principle, some systematic reviews using GRADE may unintentionally mislead, since it cannot be assumed that users will interpret ‘moderate’ in accordance with GRADE’s stipulation (Figure 1).

P values (modified from https://xkcd.com/1478/).
Footnotes
↵i Given a Z distribution, the SE is approximated 0.36≈(1.3−0.6)/1.96.
↵ii The null hypothesis concerns the threshold H 0:θ≤1.0, why Z=0.83≈(1.3−1.0)/0.36. A Z value of ±0.83 divides the probability density function into three areas: 0.20 and 0.60 and 0.20. In a one-sided test, the p value is 0.20, and in a double-sided test it is 0.20+0.20=0.40. A Z value of 1.96 divides the PDF into the following familiar areas: 2.5%, 95% and 2.5%.
Contributors All authors contributed to the planning. SA wrote the first draft. All other authors contributed equally.
Funding This work is supported by a grant from the Swedish Foundation for Humanities and Social Sciences, grant number M14-0138:1.
Competing interests None declared.
Patient consent Not required.
Provenance and peer review Not commissioned; externally peer reviewed.