Article Text

Statistics from Altmetric.com
Introduction
‘Training is required to ensure testing practices provide high-quality, high value care’. This was a frequent suggestion in a recent survey of doctors working in an NHS Foundation Trust with two large acute care hospitals. Respondents had good reason for concern about testing practices because the survey identified 121 tests (listed in the online Appendix) that they thought provided low quality or poor value.
Because it was far from clear what training should cover, this framework for high-quality, high-value testing was developed. The scope of the structure and the accuracy of the contents were informed by critical discussion on the Evidence-Based Healthcare email list and the anonymous reviewers. It quickly became apparent that examples of low-quality, low-value testing practices are not confined to one small group of NHS hospitals in England, but are common internationally in both primary and secondary care, and that a comprehensive framework would be useful for trainees, trainers, practitionersand commissioners.
Terminology and scope
It is useful to understand ‘test’ in its broad sense. This includes not only laboratory tests, imaging investigationsand diagnostic procedures, but also questions in history-taking and items in the physical examination. Testing is high quality if it is safe, timely, efficient, effective, patient-centred and ethical. Testing is high value if the clinical benefits are substantially greater than the risks and costs of the test.
Tests can be used for multiple purposes, including diagnosis (to rule in or rule out a condition in people with symptoms), screening (to screen for a disease or risk factor in people without symptoms), risk assessment (to assess risk or prognosis in people with a diagnosis) and monitoring (to check for adverse effects and assess response in people undergoing treatment).
Principles for high-quality, high-value testing
These principles for high-quality, high-value testing are guidelines. As with all guidelines, they should be applied with common sense and clinical judgement. In the context of testing, a vital aspect of clinical judgement is the skill of taking uncertain quantitative data and obtaining useful qualitative information. Figures 3–6 show how this can be done.
Principle 1. Base testing practices on the best available evidence
Decisions about using a diagnostic test should be based on critically appraised evidence on three key questions. (1) Does using the test improve patient outcomes? (2) Does using the test improve on information provided by the history, examination and other cheaper or more readily available tests? (3) How accurate is the test?
Ideally, tests should be assessed in terms of their ability to improve patient-important outcomes, but this information is unfortunately often not available.
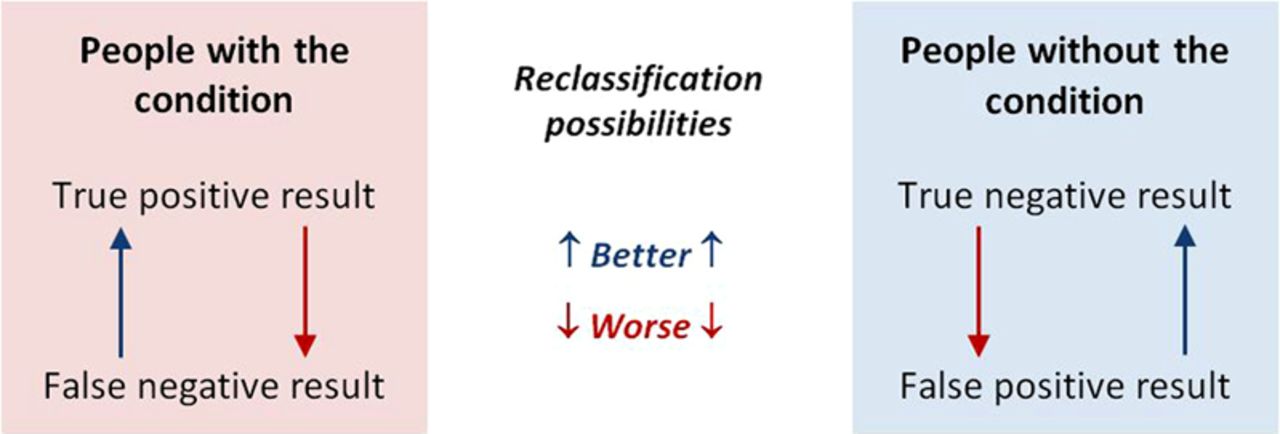
Information on the relative performance of tests may be easier to obtain. Tests will usually be done in a sequence, beginning with the cheapest and least invasive (ie, history and physical examination) as illustrated in figure 6. When a diagnostic test is performed, it will classify people as having or not having a condition. As all tests can have false-positive and false-negative results, the next test in a series will reclassify some people correctly and others incorrectly as illustrated in figure 1.

Reclassification possibilities with the last in a series of tests. This figure is only reproduced in colour in the online version.
The net reclassification index (NRI) quantifies the additional information provided by adding a second test.1 NRI can be calculated, but, more usefully for our purposes it can be visualised as the area between the receiver operating characteristic (ROC) curves for the two tests as in figure 2.

Receiver operating characteristic (ROC) curves for C reactive protein (CRP) and procalcitonin (PCT) levels for serious infection. The area between the ROC curves represents the net reclassification index (NRI), which is negative for PCT compared to CRP. The graph is from van den Bruel et al,2 and reproduced with permission from the publishers. This figure is only reproduced in colour in the online version.
An ROC curve is a plot of sensitivity against (1−specificity), and shows the test's performance. The better the test, the closer the ROC curve approaches the top left-hand corner, which represents the combination of 100% sensitivity and 100% specificity.
The NRI is positive when the second test is generally more accurate than the first and decreases diagnostic uncertainty. The NRI is negative when the first test is generally more accurate than the second, that is, the second test increases diagnostic uncertainty.
Critical appraisal point: if the ROC curves in figure 2 had been plotted on separate graphs, they would clearly show that both tests perform well. But, this would make it difficult to see that doing the second test adds no useful information.
If there is insufficient evidence about the effect of doing a test on patient outcomes, and no robust information on the additional value provided by doing the test, evidence on its diagnostic accuracy should be considered.3 A test's diagnostic accuracy is assessed in terms of its sensitivity, specificity and likelihood ratios, and positive and negative predictive values.
Positive and negative predictive values are attractive because they are clinically intuitive. But, because they are critically dependent on prevalence, published predictive values may not be applicable in practice, especially if they come from case–control studies. These commonly have approximately equal numbers of people with and without the condition being tested for, so the prevalence is about 50%. However, in clinical practice, the prevalence is often much less than 50%.
Specificity and sensitivity can also vary with prevalence—significant differences in case-mix between the study and clinical practice can therefore result in spectrum bias in the accuracy measures.
The evidence should be critically appraised with regard to the effect size, the data's precision (as measured by CIs around estimates), risk of bias and directness of applicability to the patient. Two rules of thumb can help interpret evidence on test performance.
-
For a test to be useful, sensitivity+specificity should be at least 1.5 (halfway between 1, which is useless, and 2, which is perfect).
-
Prevalence critically affects predictive values. The lower the pretest probability of a condition, the lower the predictive values.
Principle 2. Apply the evidence on test performance with careful judgement
As the evidence on prevalence and test performance is often imprecise, indirect or unknown, applying it to clinical decisions requires careful clinical judgement when estimating post-test probabilities.4 The four rules of thumb illustrated in figure 3 can help apply evidence on test performance to clinical practice.
-
There is no certainty. The range of probabilities does not begin with ‘condition absent (0%)’, and does not end with ‘condition present (100%)’.
-
Uncertainty can only be reduced, not removed, by testing. Figure 3 illustrates that with moderately high specificities and sensitivities, testing moves the probability of the condition being tested for up or down only one likelihood category.
-
The threshold for action depends on the clinical stakes. Figure 3 illustrates the situation where the stakes are high, and the threshold for action is correspondingly low, as with bacterial meningitis. A low predictive value (post-test probability) can be clinically useful in this situation. For example, the predictive value of neck stiffness or petechial rash for meningitis is in the ‘uncertain’ category in figure 3 when the pretest probability is ‘unlikely’, and further examination such as lumbar puncture would be warranted.
-
There is no point in testing, if the result will not guide management. With the situation illustrated in figure 3, there is no point in testing when the pretest probability is very unlikely or likely, or very likely—these prevalence groups are labelled ‘Don't test’.
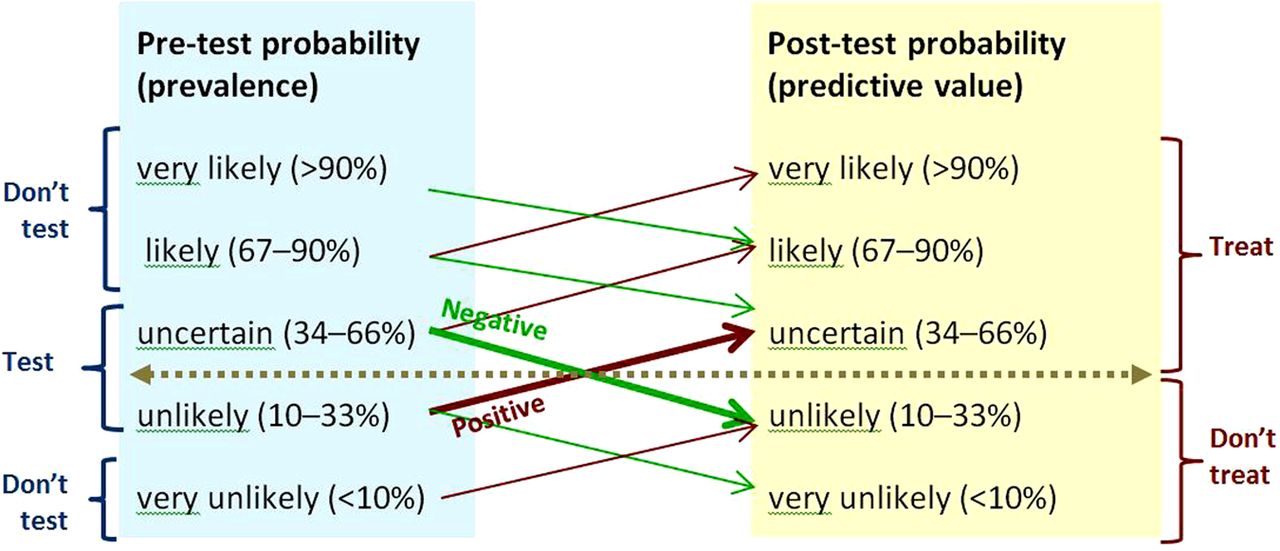
Rules of thumb for testing when sensitivity and specificity are 80–90%, and positive and negative likelihood ratios 4–9 and 0.3–0.1.5 The horizontal line shows the threshold for action. Upward-sloping lines point to positive predictive values. Downward-sloping lines point to negative predictive values. The angles of the prediction lines reflect the likelihood ratios. Thick prediction lines show results that change management. Thin prediction lines show results that will not change management. The moderate slopes of the prediction lines reflect the combination of moderately high sensitivity and moderately high specificity. Prevalence categories are labelled ‘Don't test’ if the result of testing will not change management. This figure is only reproduced in colour in the online version.
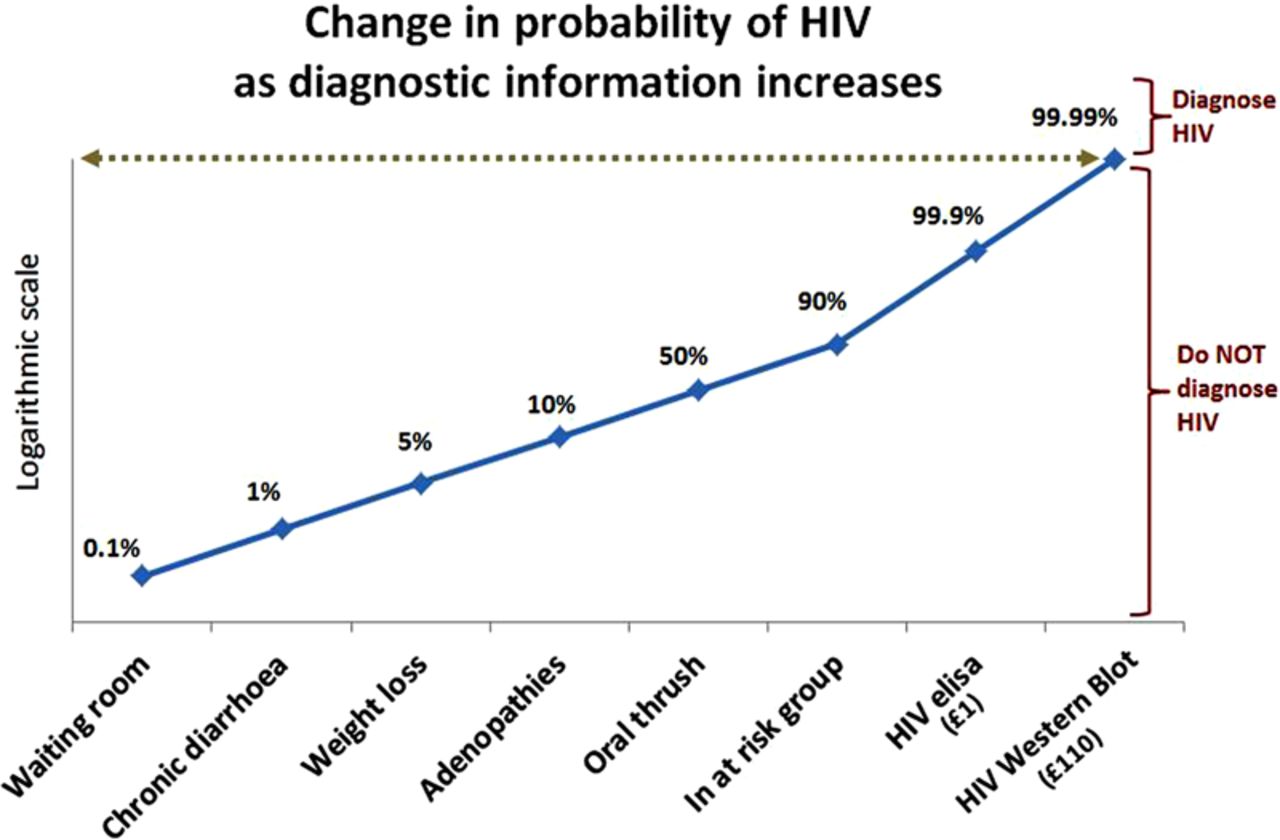
Figure 3 is representative of tests with moderately high sensitivity and specificity, and is the appropriate model to use when test performance is unknown but thought to be acceptable. Figure 4 illustrates how tests with high specificity and low sensitivity are useful in ruling diagnoses in—SPin. If the prevalence of the condition is very low (as it is with screening), a test has to be very highly specific to reduce the number of false-positive results to an acceptable level. Figure 5 illustrates that the more sensitive a test, the better it is at ruling out a diagnosis—SNout. Figure 6 illustrates how post-test probability changes with a series of tests (including items from the history and examination). The logarithmic axis enables the graph to show the discriminatory power of the tests at the ends of the spectrum.

SpIn—rule of thumb for using a test with high specificity and low sensitivity. For example, HbA1c≥6.5% for diagnosing diabetes has 99% specificity and 30% sensitivity, and positive and negative likelihood ratios 30 and 0.7.6 The horizontal line shows the threshold for action. Upward-sloping lines point to positive predictive values. Downward-sloping lines point to negative predictive values. The angles of the prediction lines reflect the likelihood ratios. Thick prediction lines show results that change management. Thin prediction lines show results that will not change management. The gentle downward and steep upward slopes of the prediction lines reflect the combination of low sensitivity and high specificity. This figure is only reproduced in colour in the online version.

SnOut—rule of thumb for using a test with high sensitivity and low specificity. For example genetic typing for coeliac disease has 99% sensitivity and 54% specificity, and positive and negative likelihood ratios 2.2 and 0.02.7 The horizontal line shows the threshold for action. Upward-sloping lines point to positive predictive values. Downward-sloping lines point to negative predictive values. The angles of the prediction lines reflect the likelihood ratios. Thick prediction lines show results that change management. Thin prediction lines show results that will not change management. The steep downward and gentle upward slopes of the prediction lines reflect the combination of high sensitivity and low specificity. This figure is only reproduced in colour in the online version.

The blue line shows how the post-test probability of HIV rises as more diagnostic information becomes available from the history, examination and laboratory tests. In contrast to figures 2–4, the vertical scale is logarithmic in order to expand the scope of the extremes of the axis. With log scaling, the graph can show how the final test (HIV western blot) limits the false-positive rate to less than around 1 in 10 000—anything less than this is unacceptable for diagnosing HIV. The Figure is adapted from Henríquez.8 Probabilities in the labels are qualitatively, but not quantitatively, accurate. This figure is only reproduced in colour in the online version.
Principle 3. Test efficiently
This principle is about doing things right. For example, a test should not be repeated when the result is already available or the result will not change (as with genetic tests and when the clinical indications have not altered). Results of tests should be clearly recorded and made available or communicated to any other physician caring for the patient.
Principle 4. Consider the value (and affordability) of a test before requesting it
This principle is about doing the right thing. For example, a test should not be requested if its expected benefits are outweighed by its risks and costs.9–11 It can be difficult to assess the value of a test when the risks are uncertain or if the clinical benefits take some time to become apparent.
Corollaries: High-cost tests can provide high value if the clinical benefits are substantially greater than the risks of adverse effects and the costs. The latest technology should be used only when shown to be more cost-effective than established tests.12 The reason for testing should never be that it is a habit, the departmental routine, or the policy, or what senior colleagues (are thought to) expect. Commissioners will want to consider the affordability as well as the value of tests—in other words, a test might provide high value, but other demands on the budget could provide higher value.
Principle 5. Be aware of the downsides and drivers of overdiagnosis
Overdiagnosis is more common and less well understood than it ought to be[13].
The downsides of overdiagnosis include the negative effects of unnecessary labelling, the harms of unneeded tests and therapies, and the opportunity costs of wasted resources that could be better used to treat or prevent genuine illness.
The drivers of overdiagnosis include technological changes detecting ‘incidentalomas’ and ever smaller ‘abnormalities’ financial, career and cultural incentives rewarding increased testing and treating while penalizing underdiagnosis but not overdiagnosis; widening disease definitions; and the positive feedback loop in which detecting smaller/milder/earlier changes leads to overestimation of the prevalence of disease, and then to overestimation of the benefit of treatment, which fuels the drive to overdiagnose.
Principle 6. Confront uncertainties
Patients should be helped to embrace the many uncertainties they (and their healthcare providers) face. Many diseases are gradual and progressive, analogue processes not digital events. Many conditions cannot be diagnosed or excluded by tests—for example, dementia and wellness. Thresholds and limits are often chosen for convenience, not because they reflect nature. Thresholds and limits create artificial categories that are misleading if they are misunderstood as boundaries between having and not having a disease, or between having and not having a risk. There is a penumbra of uncertainty around every test result due to statistical variation (which is measurable and therefore visible), and risk of bias (which is not measurable, and therefore invisible—the risk has to be estimated by critical appraisal). Results can be falsely positive, or falsely negative, or truly inconclusive. No test can give a precise prognosis for survival. Prognostic results should be explained in terms of both the average (median or mean) and the distribution in the comparator population—the characteristic long tail of the survival curve can provide reason for optimism.13
Principle 7. Follow a patient-centred approach when testing
When patients request testing, address the concerns that prompted the request.
Decision about testing should take into account the patient's concerns, the clinical value of the test, risks from testing (including the consequences of false-positive and false-negative results), costs and practical considerations such as scheduling a series of tests.
Before testing, patients should understand what the management options are if the result turns out to be positive, inconclusive or negative. Patients should also understand what support can be offered should the result be distressing. Although the elderly patient generally has the greatest levels of risk, the temptation to test should be tempered by carefully assessing if it could be useless, distressing or harmful.
Decisions about testing should (where possible) be made jointly with the patient and/or their carers.14
Principle 8. Consider ethical issues
Testing should be done for a positive reason. No test should be done solely to defend against legal action (unless defensible indications are documented), act as a placebo, comply with the patient's demands, delay action while nature takes its course, or avoid confronting the limitations of curative medicine.
Principle 9. Be aware of normal cognitive limitations and biases when testing
Cognitive limitations and biases are normal and commonly underlie diagnostic errors.15–17 A number of cognitive18 and systemic interventions19 have been suggested for reducing the rate of diagnostic errors. In particular, be aware of the pitfall of over-interpretation: not all abnormal results are clinically important, and an abnormal result may not be sufficient to explain the symptoms and signs.
Principle 10. Follow the knowledge journey when teaching and learning
Learning needs change as knowledge, skills and experience are acquired. The first steps a trainee takes along the knowledge journey are to ask ‘What should I do?’ and ‘How should I do it?’ With experience they then want to know ‘Why should I do it?’ Theory, policy, and guidance provide only part of the answer. To complete it, the evidence is required. The last step the engaged professional takes is to ask ‘How can we improve?’
Conclusion: Key questions to ensure high-quality, high-value testing
In summary, we have outlined core principles of high-quality, high-value testing, and have emphasised the need for judgements to be made after careful, considered, qualitative interpretation of test results. A short checklist of questions has been suggested for putting these principles into practice.20
-
Did the patient had this test previously? If so, what is the indication for repeating it? Is the result of a repeated test likely to be substantially different from the last result? If it was done recently elsewhere, can I get the result instead of repeating the test?
-
How will care of the patient be changed by a positive/negative/inconclusive result?
-
What is the probability of adverse consequences of a false-positive result?
-
If the test is not performed now, would the patient be at risk?
-
Is the test being ordered primarily to reassure the patient, or because they want it? If so, have the above issues been discussed with them? Are there other strategies to reassure them?
Finally, it is more complicated than that! Always remember what Algernon would have said in Oscar Wilde's unwritten play ‘The importance of being evidence-based’: The evidence is rarely pure and never simple. Modern life would be very tedious if it were either, and science-based healthcare a complete impossibility.
Additional data are published online only. To view this file please visit the journal online (http://ebm.bmj.com)
Cited articles and suggestions for further reading
The cited articles are starting points for exploring the literature on high-quality, high-value testing.
References
Supplementary materials
Supplementary Data
This web only file has been produced by the BMJ Publishing Group from an electronic file supplied by the author(s) and has not been edited for content.
Files in this Data Supplement:
- Data supplement 1 - Online appendix
Footnotes
-
Open Access This is an Open Access article distributed in accordance with the Creative Commons Attribution Non Commercial (CC BY-NC 3.0) license, which permits others to distribute, remix, adapt, build upon this work non-commercially, and license their derivative works on different terms, provided the original work is properly cited and the use is non-commercial. See: http://creativecommons.org/licenses/by-nc/3.0/