Article Text

Statistics from Altmetric.com
- STATISTICS & RESEARCH METHODS
- EPIDEMIOLOGY
- MEDICAL EDUCATION & TRAINING
- PREVENTIVE MEDICINE
- PUBLIC HEALTH
Introduction
Collecting and interpreting evidence, both clinical and analytical, is essential to the diagnostic process. This evidence may or may not support the likelihood of a patient having a given condition, depending on the nature and strength of the evidence. In practice, the range of collectable evidence is wide and includes patient profile, exposure history, symptoms and clinical or laboratory test results. In the context of evidence-based medicine, the probability of a patient having a condition of interest, given the evidence collected, should be objectively quantified. This probability is referred to as the posterior (post-test) probability of having the condition or, in conventional epidemiology, the predictive value. However, the calculations for predictive values, derived from Bayes’ theorem, are tedious and rarely performed in practice.1 ,2
Fagan's nomogram
In 1975, Dr Terrence J. Fagan3 integrated Bayes’ theorem into a nomogram for practitioners to quantify the post-test probability that an individual is affected by a condition given an observed test result and given the probability of the individual having the condition before the test was run (pretest probability). The Fagan's nomogram is widely recognised as a convenient graphical calculator and is frequently referenced in evidence-based medicine and clinically applied epidemiology textbooks.4 ,5 To use the Fagan's nomogram (as depicted in figure 1), a line must be drawn from the estimated pretest probability (left axis) through the likelihood ratio (LR) of the observed test result (centre axis) and the intersection of the line with the right axis provides the post-test probability. Regrettably, its routine use seems to be limited by the unfamiliarity of practitioners with the concept of diagnostic LRs,6 and also because LR estimates are rarely reported in studies evaluating diagnostic tests.7
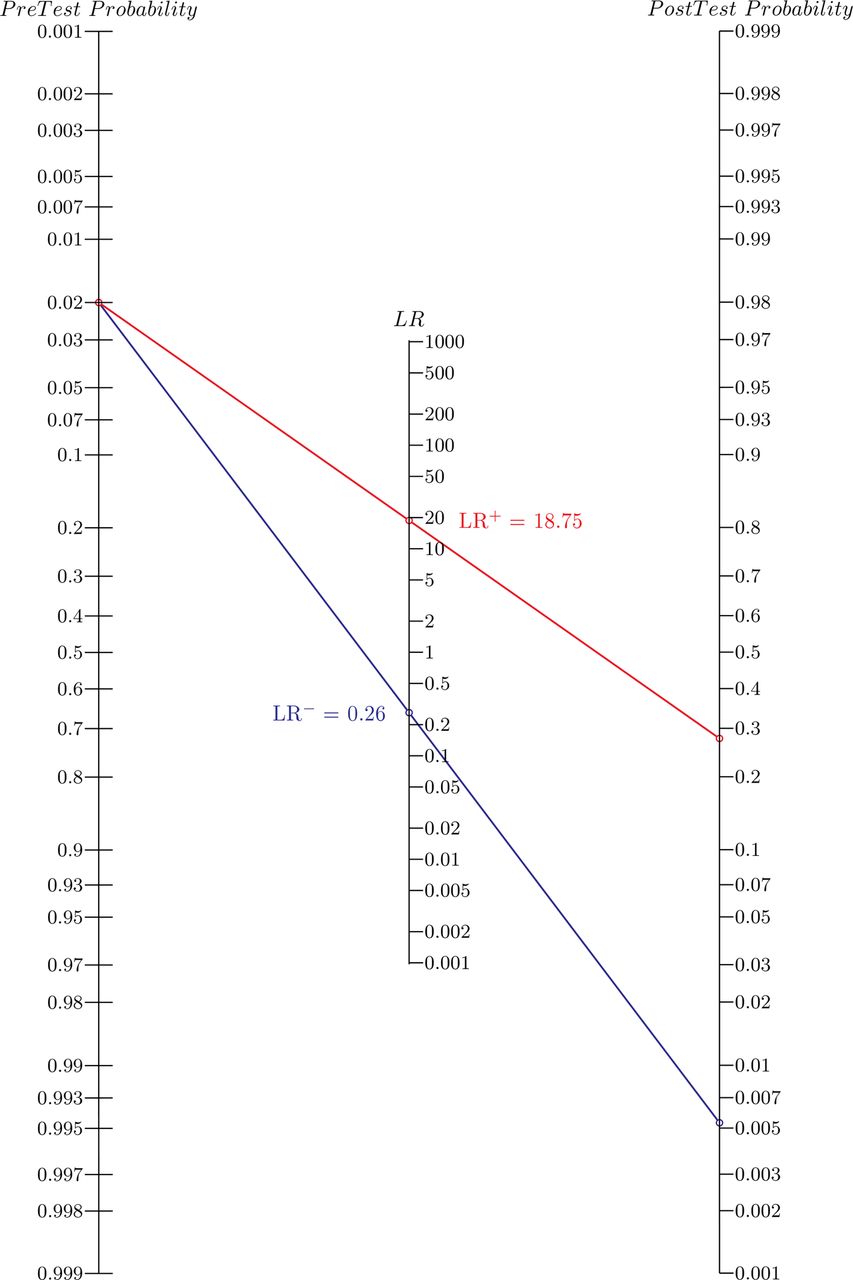
The Fagan's nomogram. For example: the MRI screening test for breast cancer in high-risk female patients has an estimated diagnostic sensitivity (DSe) of 75% and specificity (DSp) of 96%.11 It is first necessary to calculate separately the likelihood ratio of positive and negative test results (LR+ and LR−, respectively) using conventional formulae (LR+ = DSe/(1−DSp) and LR− = (1−DSe)/DSp). Given that the patient came from a high-risk population with an estimated prevalence of 2%, if this patient tests positive, the post-test probability that she truly has cancer would be approximately 28% (red line). Alternatively, if the patient tests negative, the post-test probability that she truly has cancer would be approximately 0.6% (blue line).
LR of a test result
The LR represents the direction and the strength of evidence provided by a test result. It is calculated by dividing the likelihood of the test result among patients with the condition by the likelihood of this same test result among patients without the condition.8 The values of the LR range from zero to infinity. When the LR is greater than one, the test result supports the presence of the condition (individuals with the condition are more likely to have the given test result than individuals without the condition), while, when it is lower than one, the test result supports the absence of the condition (individuals with the condition are less likely to have the given test result than individuals without the condition). An LR of one suggests that the observed test result has no diagnostic value. The farther the LR is away from one (towards zero or infinity), the stronger the evidence is provided by the test.
LRs can be estimated for binary (positive or negative), ordinal (more than two categories) or continuous (number scale) diagnostic test outcomes. However, ordinal and continuous outcomes are often dichotomised using a cut-off value to help with the decision-making process,9 and validation studies for diagnostic tests conventionally report the corresponding diagnostic sensitivities and specificities (DSe and DSp, respectively), not LRs.7 For a test with a binary outcome, two LRs are reported, one for a positive test result (LR+) and one for a negative test result (LR−). The LR+ and LR− can be directly computed from the test DSe and DSp (LR+=DSe/(1−DSp) and LR−=(1−DSe)/DSp, respectively).
The two-step Fagan's nomogram
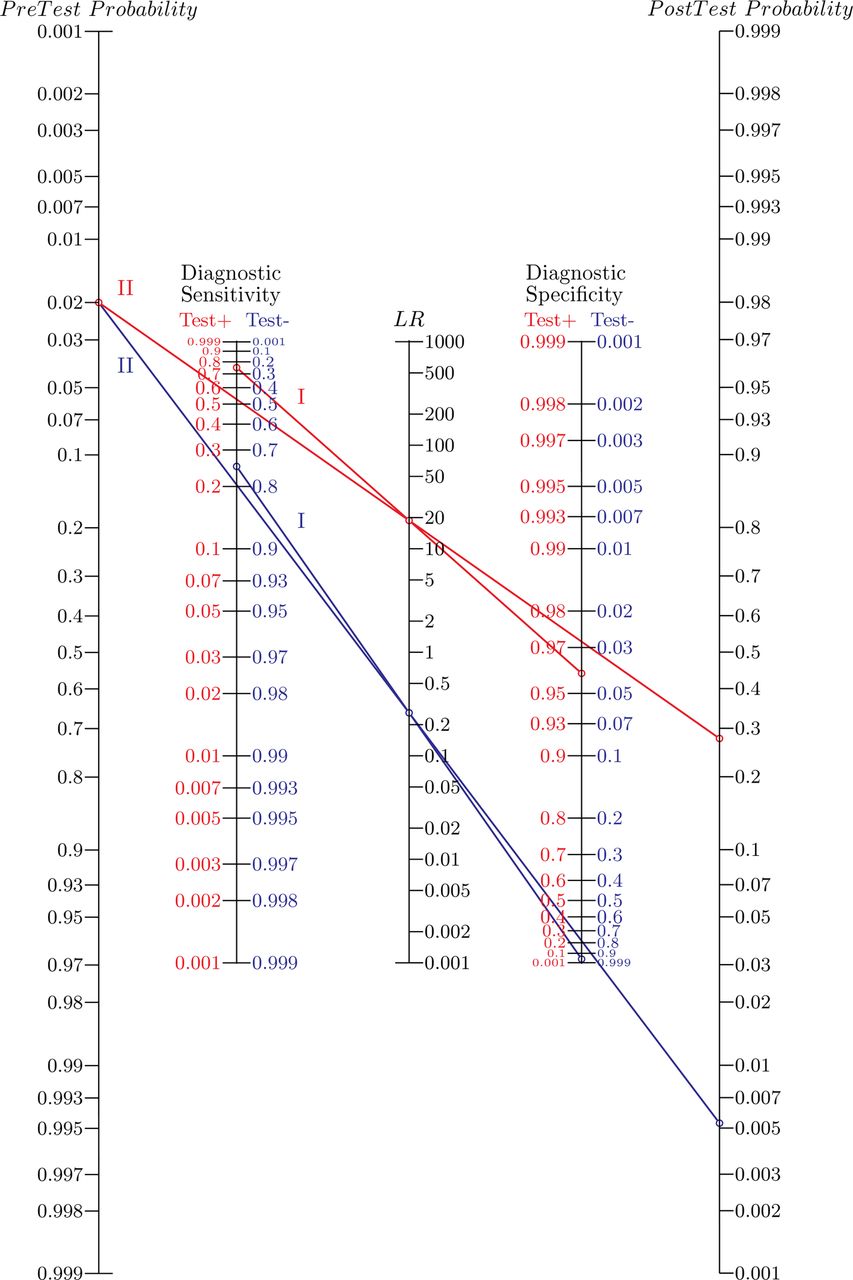
The original version of the Fagan's nomogram first requires the calculation of the LRs of the test result from the accessible DSe and DSp. The two-step Fagan's nomogram, proposed here, includes the initial calculation step for the LR+ and LR−, while maintaining the structure of the original nomogram (figure 2); it was generated using the Python-based program PyNomo,10 and the script is available from the corresponding author upon request.

The two-step Fagan's nomogram. For example: the MRI screening test for breast cancer in high-risk female patients has an estimated diagnostic sensitivity of 75% and specificity of 96%.11 A positive result from the MRI provides a likelihood ratio (LR+) of approximately 19 (red line, I). Given that the patient came from a high-risk population with an estimated prevalence of 2% and tested positive, the post-test probability for this patient to truly have cancer would be approximately 28% (red line, II). Alternatively, a negative test result would produce a likelihood ratio (LR−) of approximately 0.25 (blue line, I) and the post-test probability for this patient to truly have cancer would be approximately 0.6% (blue line, II).
User's guide for the two-step Fagan's nomogram
As compared to the original Fagan's nomogram (figure 1), the updated version includes two additional axes corresponding to the DSe and the DSp of the test (figure 2). The DSe and the DSp axes have red (left-hand side) and blue (right-hand side) scales that are used, respectively, to calculate the LR of a positive or a negative test result as a first step. The second step corresponds to the traditional Fagan's approach where the post-test probability is deducted from the previously obtained LR and the pre-test probability.
Step 1: calculation of the LR of a given test result
It is first necessary to know the DSe and DSp of the test (from the manufacturer or the literature) and to have obtained a test result from the patient (ie, positive or negative). If the obtained test result is positive, the red scales on the DSe/DSp axes must be used, whereas, if the test result is negative, the blue scales should be used. A line is drawn to connect the appropriate DSe and DSp values for the test and the intersection of the line with the central axis provides the LR of the obtained test result.
At this stage, the user can appreciate the direction and strength of the evidence provided by the test result, regardless of the pre-test probability. If the LR of the test result is greater than one and very large, the evidence provided by the test result strongly supports the presence of the condition. However, if the LR of the test result is smaller than one and very close to zero, the evidence provided by the test result strongly supports the absence of the condition. Naturally, if the LRs for the test are reported or available, this first step is not necessary.
Step 2: calculation of the post-test probability
The second step corresponds to the original use of the Fagan's nomogram. Given an estimate for the pre-test probability, a second line is drawn from the pre-test probability estimate on the far left axis through the previously obtained estimate of the LR on the central axis (from Step 1). The intercept of this line with the far right axis provides the corresponding post-test probability of the individual.
Example
The example of MRI screening for women at high risk for breast cancer is used here to illustrate the application of the two-step Fagan's nomogram (eg, in figure 2). A meta-analysis, using data from 11 MRI evaluation studies, reported estimates for the DSe and DSp at 75% and 96%, respectively.11
In the instance where the MRI yields a positive screening result for at least one breast of a patient (red scales used for the DSe and DSp axes, figure 2), the line produced in the first step indicates an LR+ of approximately 19 (red line #1, figure 2). The LR+ is greater than one and is quite large indicating that a positive result from the MRI supports the likelihood of a cancer being present. Subsequently, based on an estimated prevalence of 2% for breast cancer in these high-risk patients,11 the intercept of the line produced in the second step indicates that the probability for the patient to have breast cancer increased from approximately 2 to 28%, given the positive MRI result for this patient (red line #2, figure 2). Estimates of the prevalence are not always available in the literature for all the health conditions. In these instances, it is a common practice to use best guess estimates from clinical experience.
Alternatively, if the MRI yields a negative screening result for both breasts (blue scales used for the DSe and DSp axes, figure 2), the line produced in the first step indicates an LR− of approximately 0.25 (blue line #1, figure 2). The LR− is smaller than one and is close to zero indicating that a negative result from the MRI does not support the likelihood of a cancer being present. Subsequently, based on the previous 2% prevalence estimate, the intercept of the line produced in the second step indicates that the probability for the patient to have breast cancer decreased from approximately 2 to 0.6%, given the negative MRI result for this patient (blue line #2, figure 2).
Conclusion
The Fagan's nomogram is the simplest of the Bayes’ theorem calculators to help practitioners determine the probability of a patient truly having a condition of interest given a particular test result.4 It is particularly useful for the clinical practice when speed is favoured over precision without the need of a calculator or computer.12 However, its practicality at the bedside is limited because the initial computation of the LR, from the DSe and DSp, is missing. With the addition of this first step, the two-step Fagan's nomogram is expected to facilitate the interpretation of any test outcome (positive or negative) and enhance its utilisation for routine use by evidence-based practitioners. The Bayes’ theorem, and thus the nomogram, is the proper approach to interpret the result from one test at a time, however, users should be cautious when interpreting multiple results from a chain of tests (eg, history, clinical examination, etc.). Unless the tests used in the chain are shown to be conditionally independent (ie, the result of one test does not depend on the result of the other test given the health status), it is not recommended to use the post-test probability from one test result as the pre-test probability for the subsequent test. The two-step Fagan's nomogram can be downloaded at: www.adelaide.edu.au/vetsci/research/pub_pop/2step-nomogram/.
Footnotes
-
Competing interests None.