Article Text

Statistics from Altmetric.com
Empirical research has demonstrated that randomised controlled trials with positive findings are more likely to be submitted and published than trials with negative or null findings (OR of the likelihood of publication 3.90; 95% CI 2.68 to 5.68).1 Trials with positive findings are also published earlier (4–5 years vs 6–8 years)1 and are more likely to be published in English or in journals with higher impact.2 Thus, at any given time a meta-analysis is conducted, it will likely contain more trials with positive findings than those with negative findings and the estimated pooled effect size is likely to be exaggerated. This is a type of publication bias.
When decision makers make a recommendation based on evidence affected by publication bias, this action is supported by likely exaggerated benefit. Therefore, the balance of benefit and harm that led to the recommended action is likely distorted. Decision makers acknowledge this distortion by placing lower certainty in the evidence.3 Hence, they rate down their certainty in the evidence, which is a construct also called quality or confidence in the evidence.4
Presence of publication bias can be determined using various statistical tests. These tests have major limitations, require several assumptions that are difficult to ascertain and are commonly underpowered.5 In addition, these tests provide a binary outcome (bias is absent or present), which by itself, is a major challenge.
In this guide, we propose further evaluation of publication bias and how it impacts certainty in the evidence. We draw attention to the issues of magnitude and direction of publication bias.
Methods
We propose a framework to determine the impact of publication bias on certainty in the evidence. This framework is based on the empirical literature on publication bias, published guidance from the GRADE Working Group, and various epidemiological and statistical principles. Necessary definitions are provided in table 1.
Definitions
Direction of bias
A meta-analysis of 25 randomised controlled trials that evaluated the effects of exercise on depression has shown that exercise reduced depression symptoms (standardised mean difference (SMD) 0.98, 95% CI 0.68 to 1.28).6 The Begg test and the Egger test indicated potential publication bias (p values 0.001 and 0.004; respectively). However, it was the unpublished trials that might have shown a larger magnitude of improvement. Adjusting SMD using the trim and fill method would show a larger pooled effect of improvement (SMD 1.11; 95% CI 0.79 to 1.43).6 In other words, publication bias has led to an underestimated SMD (opposite to the typical publication bias that exaggerates benefits of interventions). This phenomenon, although not likely to be common, should intuitively prevent decision makers from reducing their certainty in the evidence when recommending exercise as a treatment for depression. This phenomenon is akin to when plausible bias and confounding suggests that the true association is stronger than the observed association.7 In the example of treating depression with exercise, the original rating of certainty in evidence would be reduced due to publication bias. However, evaluation of bias direction may prevent us from rating it down.
Visualisation of the funnel plot, although a crude and subjective approach with shapes possibly influenced by the statistic used to measure the effect size,8 9 can give a sense about the direction of bias (observation of the empty area of the funnel).
Magnitude of bias
Several methods have been proposed to determine the magnitude of bias or adjust the pooled estimate for bias. In sensitivity analysis, one can test whether the magnitude of bias is sufficiently small to the extent that it remains unimportant (will not change the decision at hand).
One of the approaches depends on selection models using the weighted distribution theory. In this approach, the probability a study is published can be modelled using certain functions of its p value or effect size, and this probability is incorporated in a meta-analysis model to adjust the effect size, possibly along with other study level covariates as regression predictors. Although they may provide some benefits in correcting publication bias,10 11 selection models are not widely used because they require a large number of studies and because of their complexity and unavailability in standard meta-analysis software.12
The trim and fill method13 is based on the funnel plot in which missing studies are imputed by creating a mirror image of opposite corresponding studies. The adjusted effect size accounting for the missing studies can be used as a sensitivity analysis to determine the presence and magnitude of publication bias. It is important to note that this adjusted effect size is based on strong assumptions about the missing studies and should only be used for the purpose of sensitivity analysis (ie, should not be considered as a more accurate effect size to be used for decision making).14
The Begg rank test and the Egger regression test have been two popular methods for detecting publication bias.8 15 Both methods examine the association between the observed effect sizes and their precisions. However, the Begg test has been found to have very low power, and the Egger test may have inflated false-positive rates for binary outcomes.16 17
A more recent measure, the skewness of the standardised deviates, quantifies publication bias by describing the asymmetry of the distribution of included trials (values range from −∞ to +∞ and a value of 0 suggests no skewness).18 The skewness is roughly considered mild, noticeable and substantial if it’s absolute value is smaller than 0.5, between 0.5 and 1, and greater than 1, respectively. Like other measures, the skewness is recommended to be reported along with its 95% CI to reflect its variability. In addition, a positive skewness measure indicates that some studies on the left side in the funnel plot (ie, those with OR or relative risk <1.0) might be missing due to publication bias. Therefore, this approach can suggest a direction and magnitude of publication bias and can be more powerful than other tests in some situations.18 For example, in a meta-analysis that evaluated nicotine replacement therapy for smoking cessation,19 three commonly used publication bias tests yielded p values greater than 0.10. The skewness measure was 0.91 (95% CI 0.14 to 1.68) suggesting substantial publication bias18 and possible unpublished studies with relative risk <0.0. In this example of nicotine replacement therapy, the original rating of certainty in evidence would not be reduced unless the magnitude of publication bias is considered.
Proposed framework
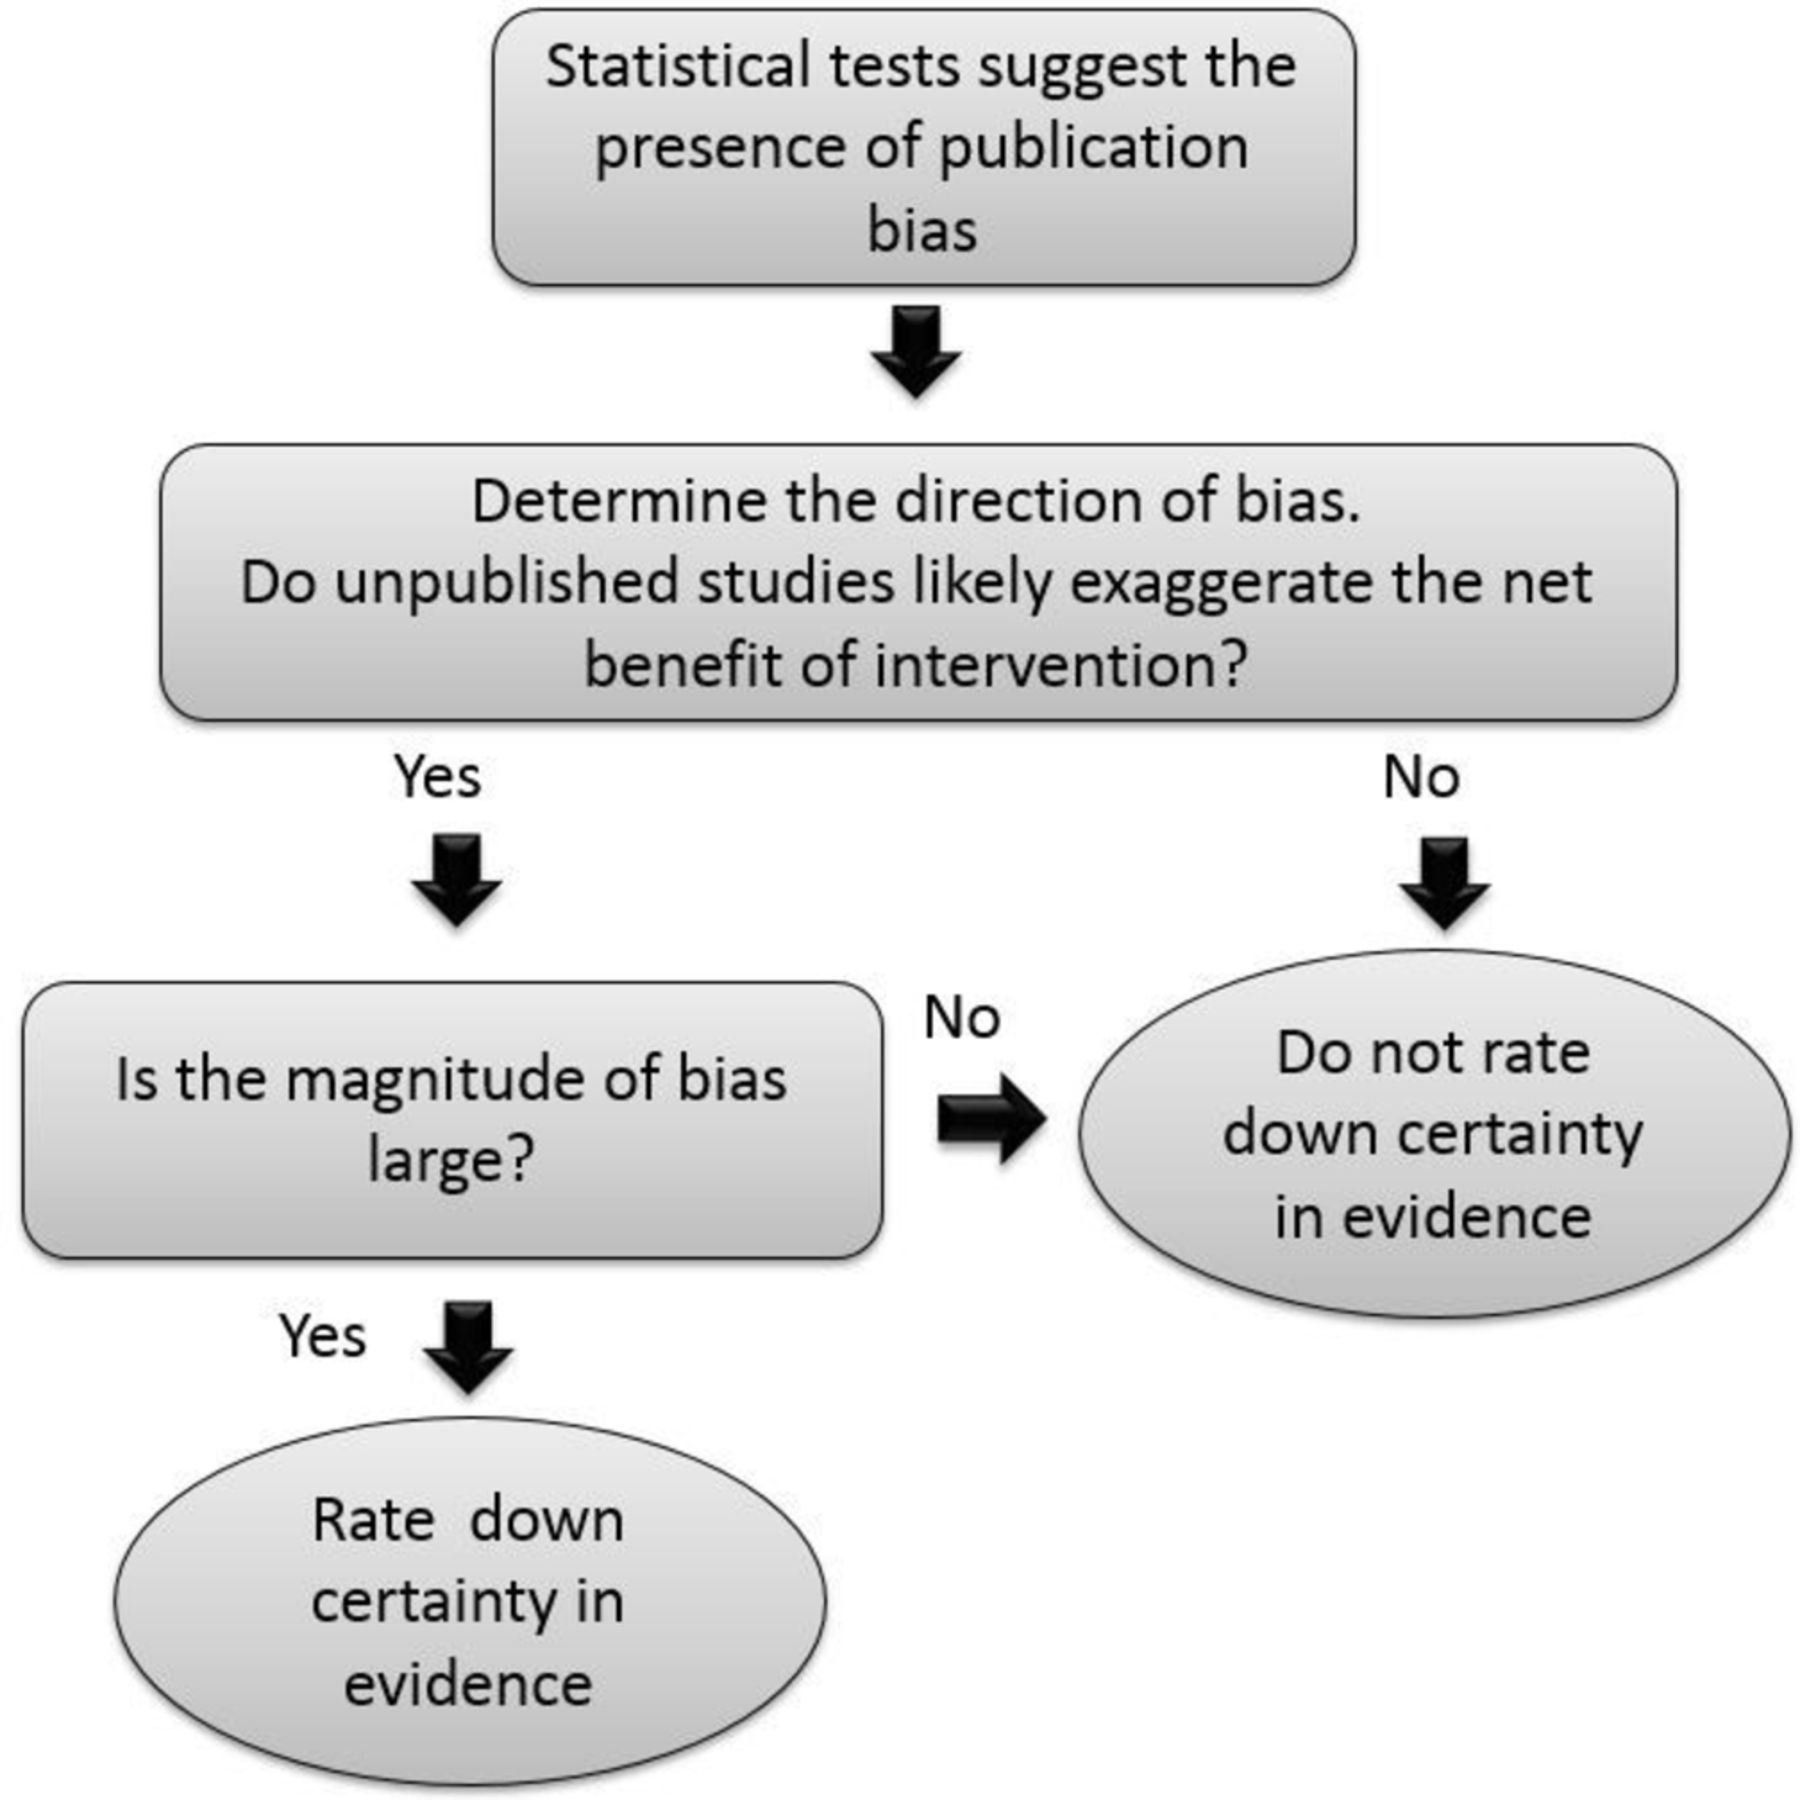
Considering the importance of the direction and magnitude of bias on certainty in the evidence supporting a particular action, we propose a framework in which certainty in evidence is compromised by publication bias only if the bias was not trivial and if it had a direction that shifts the balance of net benefit in a way that would make the recommended action less compelling (figure 1). In other words, if unpublished studies are unlikely to change the net impact of the intervention, we would not rate it down. If the magnitude or directions of the bias are unknown or are likely to affect the net impact of the intervention, then we would rate it down.

A proposed framework for determining the impact of publication bias on certainty in the evidence (incorporating the magnitude and direction of publication bias).
Discussion
Publication bias is one of the worst threats to the validity of scientific research. From an evidence synthesis perspective, we realise that the pooled estimates we produce may be based on studies exclusively showing that the treatment is effective (ie, we only see what works). This is a humbling fact. From a decision maker perspective, knowing that any decision we make is based on studies showing exaggerated benefit gives us very low certainty in our recommendations. Studies have shown that the likelihood of publication is often not associated with sample size, funding mechanism, investigator rank or gender.1 Therefore, publication bias remains unpredictable.
The available tests for publication bias lack statistical power; particularly when heterogeneity is high or the number of studies is low.20 Their validity depends on the assumptions often unmet in practice. At the present time, no single test can be recommended. Systematic reviewers should consistently use multiple publication bias detection methods, and non-statistical approaches such as comparing published evidence with data available in clinical trials registries, records of drugs or device approving agencies such as the Food and Drug Administration, and scientific conference proceedings. Searching trial registries is an important step that can reveal registered trials that remained unpublished. Three commonly searched registries are ClinicalTrials.gov (http://www.clinicaltrials.gov), International Standard Randomised Controlled Trial Number Register (http://isrctn.org) and Australian New Zealand Clinical Trials Registry (http://www.anzctr.org.au).21
Despite the low power and unreliability of the current methods, information about the direction and magnitude of the bias may inform judgements about the certainty of evidence better than the binary decision of a statistical test.
References
Footnotes
Contributors MHM conceived the idea and drafted the manuscript. HC, LL and ZW critically revised the manuscript and approved the final submission.
Competing interests None declared.
Patient consent Not required.
Provenance and peer review Not commissioned; externally peer reviewed.