Article Text

Statistics from Altmetric.com
Introduction
In 2003, the Standards for Reporting of Diagnostic Accuracy Studies (STARD) statement was published in 13 biomedical journals.1 ,2 Diagnostic accuracy studies provide estimates of a test's ability to discriminate between patients with and without a predefined condition, by comparing the test results against a clinical reference standard. The STARD initiative was developed in response to accumulating evidence of poor methodological quality and poor reporting among test accuracy studies in the prior years.3 ,4 The STARD checklist contains 25 items which invite authors and reviewers to verify that critical information about the study is included in the study report. In addition, a flow chart that specifies the number of included and excluded patients and characterises the flow of participants through the study is strongly recommended. Since its launch, the STARD checklist has been adopted by over 200 biomedical journals (http://www.stard-statement.org/).
Over the past 20 years, reporting guidelines have been developed and evaluated in many different fields of research. Although a modest increase in reporting quality is sometimes noticed in the years following the introduction of such guidelines,5 ,6 improvements in adherence tend to be slow.7 This makes it difficult to make statements about the impact of such guidelines. For STARD, there has been some controversy around its effect.8 While one study noticed a small increase in reporting quality of diagnostic accuracy studies shortly after the introduction of STARD,9 another study could not confirm this.10
Systematic reviews can provide more precise and more generalisable estimates of effect. A recently published systematic review evaluated adherence to several reporting guidelines in different fields of research, but STARD was not among the evaluated guidelines.11 To fill this gap, we systematically reviewed all the studies that aimed to investigate diagnostic accuracy studies’ adherence to the STARD checklist in any research field. Our main objective was to find out how diagnostic accuracy studies adhere to (specific items on) the STARD checklist. Our research questions were: (1) How is the current (or rather, most recent) quality of reporting of diagnostic accuracy studies? (2) Has the quality of reporting improved after the introduction of STARD? (3) How do diagnostic accuracy studies score on specific items on the checklist? (4) Are there any factors associated with adherence to the checklist?
Methods
Search and selection
The original protocol of this study can be obtained from the corresponding author. We performed a systematic review and searched MEDLINE and EMBASE, which, to our knowledge, provide the best sources for methodological reviews. To make sure that all relevant data were captured, we also searched the Methodology Register of the Cochrane Library, of which the content is sourced from MEDLINE and additional manual searches. We included studies that primarily aimed to examine the quality of reporting of articles of diagnostic accuracy studies in humans in any field of research, by evaluating their adherence to the STARD statement. Details on the search strategies are provided in Web only file 1. The final search was performed on 13 August 2013. The searches were performed without any restrictions for language, year of publication or study type. We excluded systematic reviews on the accuracy of a single test that had used the STARD checklist to score the quality of reporting in the included articles, as well as studies that investigated the influence of reporting quality on pooled estimates of test accuracy results. Such articles would be on a too specific topic to be able to make statements on the reporting quality of diagnostic accuracy studies in general. Studies focusing on reports about analytical rather than clinical performance were also excluded. Although the design of these two types of studies show many similarities, STARD was not designed for studies on analytical test performance and several items on the lists do not apply in this setting. We also excluded studies that evaluated less than 10 STARD items and studies that had not presented their results quantitatively (as a mean number of reported items or a score per individual item) because this would make an objective comparison between studies impossible.
Two authors (DK and WvE) independently screened the titles and abstracts of the search results to identify potentially eligible studies. If at least one author identified an abstract as potentially eligible, the full text of the article was assessed by both authors. Disagreements were resolved through discussion, whenever possible. If agreement could not be reached, the case was discussed with a third author (LH). One author (DK) also reviewed reference lists of included studies for additional relevant papers.
Data collection
An extraction form was created before the literature search was performed, and piloted on three known eligible studies. After the pilot, the form was slightly modified. One author (DK) extracted relevant data from the included studies which were verified by the second author (WvE). Disagreements were resolved through discussion. If necessary, a third author (LH) made the final decision.
Of each included article, the first author, country, year of publication and journal were extracted. We also identified the inclusion and exclusion criteria, research field, primary aims, the number of studies included, which STARD items were evaluated and how they had been scored. In addition, we retrieved (descriptive) statistics regarding overall and item-specific STARD adherence, and adherence comparisons between articles published post-STARD versus those published pre-STARD. Any additional study characteristics mentioned to be associated with STARD adherence were extracted. We also extracted any statistics on inter-rater agreement in evaluating STARD items, and conclusions, interpretation and recommendations of the authors.
We assessed the quality of included studies by using the 11-item AMSTAR (Assessment of Multiple Systematic Reviews) tool.12 As several items on this list do not apply to the studies included in our review, we omitted four items and only assessed items: item 1 (was an ‘a priori’ design provided?), item 2 (was there duplicate study selection and data extraction?), item 3 (was a comprehensive literature search performed?), item 4 (were inclusion and exclusion criteria provided?), item 5 (was a list of included and excluded studies provided?), item 6 (were the characteristics of included studies provided?) and item 9 (was the conflict of interest included?).
Analysis: overall adherence to STARD
We calculated κ statistics to assess inter-reviewer agreement for the two phases of study selection. For each included study, we calculated the overall STARD score, defined as the mean number of items reported by articles included in that study, and the proportion of articles adhering to each specific STARD item. For each STARD item, we calculated the median and range of these proportions.
Some studies also counted how often an item was partially reported. To be able to make comparisons between studies, we counted partially reported items as half in calculating proportions. Some STARD items pertain to the index test and the reference standard. Whenever these were analysed separately, half a point was allocated per reported item. If a study reported that an item on the STARD checklist was not applicable to all evaluated articles, that study was not included in our overall analysis for that specific item. If a study reported that a STARD item was applied to less than 100% of the evaluated articles, the score was calculated for the number of articles for which the item applied and the calculated proportions were adjusted.
Analysis: adherence to STARD before and after its launch
To obtain a summary estimate and the corresponding 95% CI of the difference in adherence before and after its launch, we used inverse variance random-effects meta-analysis.13 Only studies specifically reporting pre-STARD and post-STARD results were included in this analysis. We explored statistical heterogeneity using the I2 test.14 We performed a subgroup analysis by separately analysing studies examining a general sample of diagnostic accuracy studies, rather than those investigating adherence in a specific field of research.
One included study only reported SDs for (equally sized) subgroups of STARD-adopting and non-adopting journals.10 We calculated their overall SD by taking the square root of the pooled variances. SDs of one other study were obtained after contacting the authors.15
We used inverse variance random-effects meta-analysis to calculate summary ORs and 95% CIs for item-specific adherence in the pre-STARD versus post-STARD groups. Only studies specifically reporting the proportion of evaluated articles adhering to each individual item for the pre-STARD and post-STARD groups were included in this analysis.
Results
Search results and characteristics of included studies
Five hundred and eighteen studies were identified trough the search, of which 35 were deemed potentially eligible after screening titles and abstracts (figure 1). After studying the full texts, we were able to include 16 studies.9–28 Reasons for exclusion of potentially eligible studies are provided in figure 1⇓. No additional studies were identified through reference lists. Inter-reviewer agreement was substantial for the screening of titles and abstracts (κ=0.77 (95% CI 0.66 to 0.88)), and was perfect for the subsequent assessment of full-texts (κ=1.0).
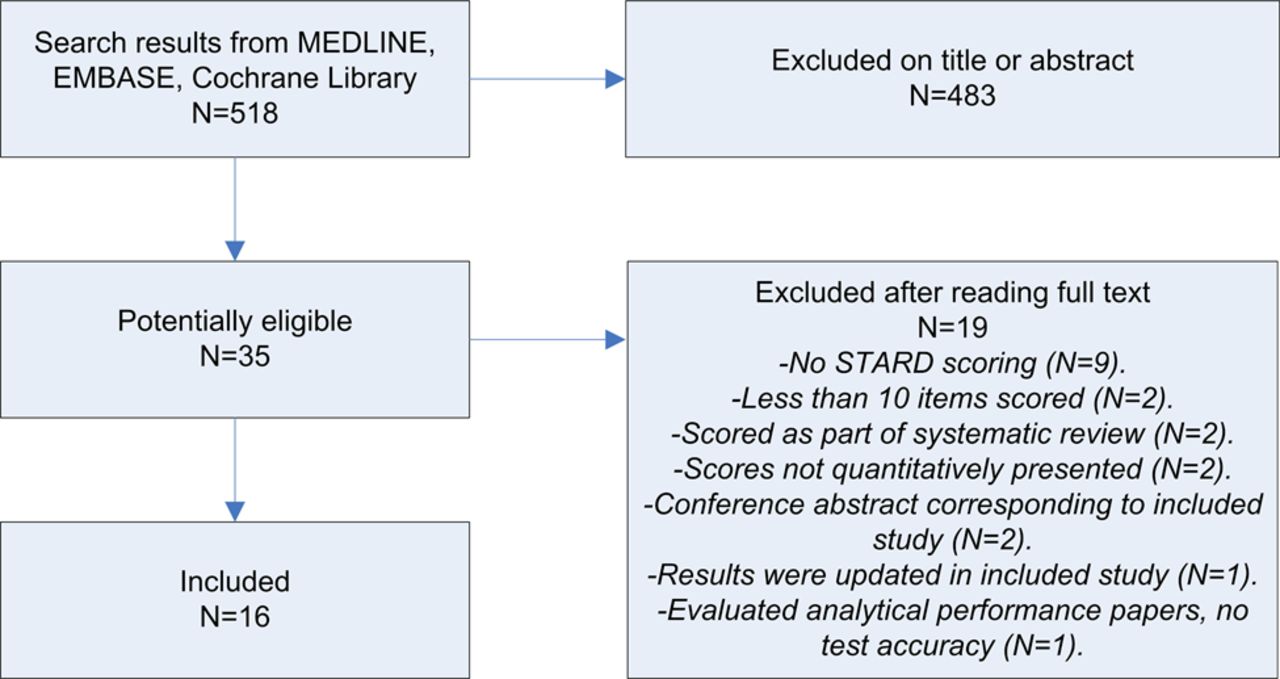
Flow chart for selection of studies.

Forest plot for studies included in meta-analysis comparing adherence post-Standards for Reporting of Diagnostic Accuracy Studies (STARD) and pre-STARD. *Wilczynski10 evaluated only 13 STARD items; the other studies evaluated 25 STARD items. **Results of the studies on obstetrics. ***Results of the studies on gynaecology.
The characteristics of the included studies are provided in table 1. Three studies investigated adherence to STARD in a general sample of articles on diagnostic accuracy studies, the other 13 had performed so in a specific field of research. None of the included studies had evaluated a recent sample of articles: one study evaluated articles published through 2010, one study through 2008, two studies through 2007 and four studies through 2006. All other studies included only articles published before 2006. Twelve studies included articles published before and after STARD's launch. One study investigated only articles published pre-STARD and three studies investigated only articles published post-STARD.
Characteristics of included studies
The number of evaluated articles varied markedly between the included studies, with a median of 55 (range 16–300). Most of the studies (n=13) evaluated all 25 STARD items. However, among three of these, one item was found not applicable to all included articles. The other three studies had evaluated 24, 22 and 13 items of the 25 items, respectively. κ Values for overall inter-rater agreement on the STARD-items were reported by nine studies: moderate agreement (κ=0.41–0.6) was achieved in one study, substantial agreement (κ=0.61–0.8) in six studies and almost perfect agreement (κ=0.81–1.0) in two other studies.29 An overall percentage agreement was reported by seven studies; this varied between 81% and 95%. Four studies did not report on inter-rater agreement.
An a priori study design was provided by only one included study. Seven studies performed the complete study selection in duplicate, while three did so in part. Eleven studies evaluated the reporting quality of all the included studies in duplicate, and three did so for a part of the included studies. All the included studies provided comprehensive data on the literature searches and the inclusion and exclusion criteria. Although more than half (n=9) of the studies provided a list of included studies, only two provided a list of excluded studies. Characteristics of included studies were provided, to some extent, by all studies: all gave information on the research field in which included articles were performed and 12 studies gave information on the type of tests used. Only three studies gave information on the included studies’ design.
Overall adherence to STARD
The overall mean STARD score varied from 9.1 to 14.3 for the 13 studies that had evaluated all 25 STARD items, with a median of 12.8 items (table 1). Fifteen (94%) of the included studies concluded that the adherence to STARD was poor, medium, suboptimal or needed improvement. One study used more conservative language and concluded that adherence of included articles was highly variable. Seven studies evaluating all 25 items only reported post-STARD results or reported pre-STARD and post-STARD results separately. The overall mean number of items reported in these post-STARD results varied from 12.0 to 15.5, with a median of 13.6. Most of the included studies recommended the use of STARD as a guideline to improve the quality of reporting of diagnostic accuracy studies, and no study discouraged it.
The medians and ranges of the proportions of adherence to individual STARD-items reported by included studies are provided in table 2. There was a large between-study variation in adherence to specific items. Overall, only 12 items had a median proportion exceeding 50%; only three items had a median proportion above 75%. When only evaluating post-STARD results, these median proportions were slightly better: 15 items exceeding 50% and 6 items exceeding 75%. Six items (8, 9, 10, 11, 13 and 24) concern the index test as well as the reference standard. Reporting of the index test was better than reporting of the reference standard for all of these items.
Proportions of adherence to individual STARD items
Several studies reported on factors potentially associated with quality of reporting. One study found that adherence to STARD was significantly better for cohort studies compared with case–control studies,9 but another study could not confirm this.24 Other factors reported to be significantly associated with higher STARD scores were sample size (higher scores among larger studies15) and research field (obstetric studies scored better than gynaecological studies,15 and tuberculosis and malaria studies scored better than HIV studies18). Factors that did not show a significant difference were geographical area,15 level of evidence24 and pooled sensitivity and specificity,28 but these findings were not replicated in a subsequent study.
Adherence to STARD before and after its launch
Of the 12 studies that had included articles published before and after the publication of STARD, 6 reported results for the pre-STARD and post-STARD groups. These were included in the meta-analysis. Combining these studies in a meta-analysis showed that significantly more items were reported post-STARD, with an estimate difference of 1.41 items (95% CI 0.65 to 2.18). However, the great majority of the 383 post-STARD articles included in this analysis were published in the 2 years after introduction of STARD (2004 and 2005, n=349); only 34 articles were published after 2005. As expected, I2 test showed evidence of substantial statistical heterogeneity (66%). Subgroup analysis of the two studies that reported on a general sample of diagnostic accuracy studies9 ,10 showed a non-significant increase in the number of reported STARD-items (difference of 1.02 items (95% CI −0.08 to 2.12), I2=80%).
Six other studies have reported some form of analysis of STARD adherence over time. One of these noticed an upward trend in the number of items reported pre-STARD and post-STARD.23 Four others could not confirm this: two studies reported that introduction of STARD did not seem to have improved the quality of reporting of articles included in their analysis,21 ,22 one study observed no improvement of quality of reporting over time27 and one study noticed a (non-significant) decline in adherence after STARD publication.20
The pre-STARD versus post-STARD meta-analyses for individual items are reported in Web only file 2. Six items were significantly more reported after the publication of STARD: item 4 (describes participant recruitment), item 5 (describes participant sampling), item 6 (describes data collection), item 14 (reports dates of study), item 15 (reports characteristics of study population) and item 23 (reports estimates of variability of accuracy). Although still rare, the number of studies reporting a flow diagram also increased significantly. None of the STARD items showed a significant decrease in frequency of reporting.
Discussion
In this systematic review, we evaluated adherence to STARD. We were able to include 16 studies, together evaluating 1496 articles on diagnostic accuracy studies. The overall quality of reporting in these articles, published both in general and in disease-specific journals, was moderate, at least through halfway the 2000s, confirming the necessity of the introduction of STARD. Results of overall adherence were consistent among all included studies, and varied from 9.1 to 14.3 items being reported, of the 25 items on the checklist. Several factors were reported to be associated with STARD adherence by individual studies, but none of these associations was confirmed by a second study.
Although modest, there seemed to be an improvement in reporting quality (1.41 items (95% CI 0.65 to 2.18)) in the first years after STARD's publication in 2003 compared with articles published pre-STARD. Even though the CI is wide, this improvement is significant. The fact that the quality of the seven analyses included in this meta-analysis was acceptable, and that all of them showed an increase in reported items (three of them significant), increases our confidence in the estimates of effect.
Our study has several potential limitations. Most of the studies evaluated articles on diagnostic accuracy studies published before 2006; none evaluated articles published after 2010. Therefore, we cannot comment on how diagnostic accuracy studies currently adhere to STARD. Most of the included studies reported a substantial inter-rater agreement on individual items, with marked differences between studies in reported frequencies of adherence to specific items (table 2). There was also considerable heterogeneity in our meta-analysis comparing pre-STARD and post-STARD adherence. It is likely that this can, at least partially, be explained by between-study differences in scoring for specific items. For example, while some studies indicated that for item 3, at least the inclusion and exclusion criteria had to be reported, others only considered this item as fully reported when the setting and locations were also described. Only seven studies specifically reported how often an item was judged not to be applicable to the evaluated articles, while the others did not. Therefore, we were not always able to do a mathematical correction for non-applicable items. It is difficult to say whether between-study differences in scores of specific items were caused by a great diversity in adherence in the respective research fields, by heterogeneity in methods of scoring or both. We would have liked to compare the differences in compliance between STARD-adopting and non-adopting journals, and between high-impact and low-impact journals, but were unable to do so, because this information was almost never available in the included studies.
Although the overall quality of reporting was moderate, several items scored relatively good, with a median proportion of 70% or higher: item 2 (research questions/aims), item 4 (participant recruitment), item 7 (reference standard), item 8 (technique of index test and reference standard), item 9 (units/cut-offs/categories of tests), item 15 (study group characteristics) and item 25 (clinical applicability of findings). Worrisome is the fact that more than half of the 25 STARD items had median proportions of adherence under 50%. Especially, the reporting of study methods and results was suboptimal.
Seven items scored remarkably poor, with a median proportion of 30% or lower: item 10 (persons executing the tests), item 11 (blinding of readers), item 13 (methods for calculating test reproducibility), item 16 (the number of eligible patients not undergoing either test), item 20 (adverse events), item 22 (handling of missing results) and item 24 (estimates of test reproducibility). This is particularly alarming because several of these items can be related to biased results. If no or incomplete information on such items is reported, the potential for bias cannot be determined. Review bias, which can result when readers of a test have knowledge of the outcome of other tests or additional clinical information (item 11),3 and verification bias, which occurs when a patient is only tested by the reference standard in case of a positive index test (item 16),30 are likely to give inflated estimates of diagnostic accuracy. Limited test reproducibility (items 13 and 24), an effect of instrumental and/or observer variability, and not including missing responses or outliers (item 22), can also introduce biased or imprecise accuracy estimates.2 Interestingly, for all the six items that apply to the index test and reference standard, adherence was better for the index test. Since accuracy estimates of an index test completely depend on the reference standard, authors should be encouraged to provide all the relevant information of both tests. Finally, flow charts were rarely reported, both pre-STARD and post-STARD. Since these highly facilitate a reader's assessment of study design, their use should be further promoted.
Owing to a constant increase in technological and scientific innovations, the number of available diagnostic tests has been growing exponentially over the past decades. Diagnostic tests are indispensable in patient management since many clinical decisions depend on their results. Implementation and proper usage of a test in any given clinical setting should be based on a thorough consideration of its costs, safety and clinical performance and utility. High-quality diagnostic accuracy studies are crucial in this consideration. Compared with other forms of research, diagnostic accuracy studies are probably more sensitive to bias.3 ,31 The STARD checklist facilitates a complete and transparent reporting of diagnostic accuracy studies and, consequently, allows readers (clinicians, editors, reviewers, policy makers, etc) to identify sources of bias that may influence the clinical value and generalisability of a test. While reviews of diagnostic studies often struggle with high heterogeneity, complete and transparent reporting would facilitate an identification of potential sources of heterogeneity.
Although we have presented evidence that the quality of reporting of diagnostic accuracy studies is slowly increasing, it seems that there is still significant room for improvement. A recent study showed that adherence to guidelines is also suboptimal in other fields of research.11 Although the scientific community seems to become more and more aware of the importance of transparent reporting, further enforcement of reporting guidelines among researchers, editors and peer reviewers is a necessity. We strongly recommend authors of diagnostic accuracy studies to take STARD into account from the stage of designing the study and onwards. This way, the items can easily be incorporated in the final article. In addition, this may lead to an increased awareness among authors about potential sources of bias, which allows them to take preventive measures and, consequently, also increases the methodological quality of their study. In addition, we recommend that an evaluation of adherence to STARD should be performed on a more recent cohort of diagnostic accuracy studies. A systematic review has recently shown that, after the introduction of the CONSORT (Consolidated Standards of Reporting Trials) statement, adopting journals had a larger increase in reporting quality of randomised controlled trials than non-adopting journals.7 Such information may be useful in the effort to convince journal editors of the necessity of adopting reporting guidelines. Future evaluations can compare reporting quality of diagnostic accuracy studies between STARD-adopting and non-adopting journals. This way, an estimation of the impact of adopting STARD on reporting quality can be made.
References
Supplementary materials
Supplementary Data
This web only file has been produced by the BMJ Publishing Group from an electronic file supplied by the author(s) and has not been edited for content.
Files in this Data Supplement:
- Data supplement 1 - Online supplement
- Data supplement 2 - Online supplement
Footnotes
-
Competing interests None.