Article Text

Abstract
Objectives: To study serial measures of maximum QT interval corrected for heart rate (QTc) and QT dispersion (QTD) and their association with cardiac mortality patients with non-insulin dependent diabetes and to compare QT abnormalities with other mortality predictors (ankle brachial pressure index (ABPI) and autonomic function tests) in their ability to predict cardiac death.
Setting: Teaching hospital.
Methods and patients: QT interval analysis, heart rate (RR) variation in response to deep breathing and standing, and ABPI were analysed in 192 patients with non-insulin dependent diabetes. Cardiac death was the primary end point.
Results: Mean (SD) follow up was 12.7 (3.2) years (range 1.2–17.1 years). There were 48 deaths, of which 26 were cardiac. QTc and QTD were individually significant predictors of cardiac mortality throughout the follow up period (p < 0.001). The predictability of QT parameters was superior to the predictability of ABPI and RR interval analysis. Temporal changes in QT parameters showed that the mean absolute QT parameter was a significant predictor of cardiac death (p < 0.001), whereas an intraindividual change in QT parameter over time was not predictive.
Conclusion: QT abnormalities seem to exist at the point of diagnosis of diabetes and do not appear to change between then and the subsequent cardiac death. Furthermore, the analysis of QT interval is superior to ABPI and the RR interval in identifying diabetic patients at high risk of cardiac death.
- ABPI, ankle brachial pressure index
- QTc, QT interval corrected for heart rate
- QTD, maximum heart rate corrected QT interval
- QTD, QT dispersion
- ROC, receiver operating characteristic
- UKPDS, United Kingdom prospective diabetes study
- diabetes
- QT interval
- ankle brachial pressure index
- autonomic function
Statistics from Altmetric.com
- ABPI, ankle brachial pressure index
- QTc, QT interval corrected for heart rate
- QTD, maximum heart rate corrected QT interval
- QTD, QT dispersion
- ROC, receiver operating characteristic
- UKPDS, United Kingdom prospective diabetes study
The prevalence of non-insulin dependent diabetes mellitus is increasing worldwide1 and is estimated at 2–6% in most European countries. Insulin resistance precedes the development of overt diabetes by many years.2 The principal cause of death in diabetes is cardiovascular in over 60% of patients with an annual mortality of about 5.4%,3 thereby reducing life expectancy by as much as 10 years.4
The problem of cardiac death in diabetes is compounded by the fact that diabetic patients who survive an acute coronary syndrome have greater complications of arrhythmias, heart failure, and death5–7 and by the fact that interventions in the form of coronary artery bypass grafting and percutaneous coronary angioplasty are associated with lower rates of survival.8
To begin to reverse the high cardiac death rate, there is a need for a simple screening test, enabling early detection at a time when overt cardiac disease is absent. The ability to identify such high risk patients should enable us to target interventions earlier in order to reduce cardiac morbidity and mortality. Such measures may include ultra-aggressive statin treatment, ultra-tight blood pressure control, early revascularisation, and perhaps a greater use of implantable cardiac defibrillators.
One possible way to risk stratify diabetic patients is to use QT interval analysis measured from ECGs. QT abnormalities can predict cardiac death in several disease states, including chronic heart failure,9–11 systemic hypertension,11 and peripheral vascular disease.12 In a more recent population based study of American Indians (the strong heart study)13 QT interval corrected for heart rate (QTc) was a significant predictor, after adjustment for multiple known predictors of adverse outcome, for both all cause and cardiovascular mortality, and QT dispersion (QTD) remained a significant predictor of cardiovascular mortality. Only a proportion of this study population had diabetes. With regard to non-insulin dependent diabetes, two studies have already shown that QT interval abnormalities are particularly good predictors of cardiac death.14,15
However, many crucial questions remain about our ability to stratify cardiac risk in diabetes. Cross sectional population studies have clearly shown that QT interval abnormalities are associated with an increased risk of death, but no longitudinal studies have determined whether QT abnormalities worsen over time as patients destined for cardiac death near this event. Indeed the recently published strong heart study,13 which helped to establish the predictive value of QT abnormalities for mortality, stated clearly the need for such studies to address whether intra-individual changes in the QT interval are even more predictive of cardiac death. Our present analysis was designed to address this very question. It may be that intra-individual worsening in QT interval length is more informative than the absolute value itself.
Another important question about our ability to predict cardiac death in diabetes is which of the proposed predictors (QT interval analysis, ankle brachial pressure index (ABPI), and autonomic function tests) performs best in a head to head comparison. Therefore, the second aim of this study was to compare the ability of QT interval analysis to predict cardiac death with the ability of ABPI or autonomic function tests to make the same prediction. Our study also addressed a third important question, which is whether the ability to predict cardiac death in diabetes is enhanced by combining the three predictors rather than using any single one alone.
To achieve these three aims we used an extended dataset of a previous study.14 In our earlier analysis we focused only on QT interval abnormalities without looking at intraindividual changes over time and without comparing them with other predictors.
METHODS
We studied the Dundee cohort of the UKPDS (United Kingdom prospective diabetes study),16 in which 231 patients with newly diagnosed non-insulin dependent diabetes were recruited between 1982 and 1988. The details of this study are reported elsewhere16; in short, the UKPDS is a multicentre, prospective, randomised intervention trial of 5102 patients with newly diagnosed non-insulin dependent diabetes whose aim was to determine whether improved glucose and blood pressure control would prevent complications and improve morbidity and mortality. Serial data were available to us, which included those parameters mentioned above; however, details of diabetic complications including microalbuminuria and presence of retinopathy were not, which would have been an interesting addition to the analysis. Ethical approval was given by the Tayside committee on medical research ethics and each patient gave written consent as part of the multicentre trial. Patients with overt cardiac disease were excluded if there was a history of myocardial infarction in the previous year, current angina, or heart failure. All patients underwent three yearly clinical assessments. Serial data were collected at entry (baseline), three years, and six years.
Measurements of ABPI, autonomic function tests, and ECG analysis
On each occasion a full clinical examination was performed. Following this, a series of bedside tests were conducted, including measurement of heart rate (RR) variation in response to deep breathing17 (inspiratory minus expiratory heart rate, RR interval) and to standing18 (ratio of the 30th to 15th heart beat on standing, RR ratio) to assess autonomic function.
Doppler systolic artery pressures were measured in both legs and in the right arm, and were expressed as a ratio to give the ABPI.
ECGs were also obtained for QT interval analysis. Patients were excluded from the present study if they were not in sinus rhythm, had bundle branch block, or had other intraventricular conduction delay. These exclusions were imposed as interpretation of such ECGs is difficult and the resultant prolonged QT intervals may be misleading (that is, the cause of cardiac death may be wrongly construed as a function of the duration of intraventricular conduction delay).
A single observer (AAON), blinded with respect to the group being analysed, measured QT and RR intervals of a 12 lead ECG in all measurable leads (⩾ 10 leads in 91% of patients, nine leads in 8%, and eight leads in 2%) by a manual method with an image digitising system. QT interval was measured from the onset of the QRS complex to the end of the T wave (that is, return to TP isoelectric baseline). In the presence of U waves, the QT interval was measured to the nadir of the curve between the T and U waves. For all patients the 12 leads were recorded sequentially with enough complexes in each lead, so that it was possible to take the average of three consecutive QRS complexes for each lead. QT intervals were corrected for heart rate by Bazett’s formula (QTc = QT / RR1/2).
The intraobserver coefficient of variation for QTc was 6–10%. The repolarisation abnormalities were assessed based on the maximum QT interval (QTcmax, the maximum heart rate corrected QT interval from the 12 lead ECG) and QTD (the maximum QT interval minus minimum QT interval taken from the 12 lead ECG).
Serum cholesterol was not measured, as this trial was conducted in the early 1980s before the widespread application of this measure. Other parameters that would have been of interest, such as echocardiographically derived left ventricular function, were also not measured in this study. Unfortunately, ECGs were available only from the Dundee cohort of the UKPDS, which prevented this kind of analysis being done in the whole of the UKPDS population.
Study end point
Cardiac death was the primary end point. Information on all cause mortality was obtained. Cardiac death was classified at the coordinating centre in Oxford according to the International classification of diseases, 9th revision codes 410–414.9. Deaths were therefore classified as cardiac if this resulted from congestive cardiac failure, myocardial infarction, or sudden death resulting from coronary artery disease.
Cardiac death was classified independently by two clinical assessors at the coordinating centre in Oxford. If there was disagreement, the information was submitted to two further independent assessors for final decision. The assessors in Oxford were at all times blind to the QT interval analysis performed in Dundee.
Statistical analysis
We used one way analysis of variance and χ2 to test for overall differences between groups (survival, cardiac death, and non-cardiac death). For survival analysis, observation began on the date of ECG recording at entry into the study for baseline data, at three years after entry for three year data, and similarly for six years. Data are presented as mean (SD). We constructed Kaplan-Meier survival curves. Mortality was analysed by fitting Cox proportional hazard models to evaluate the significance of multiple variables. Receiver operating characteristic (ROC) curves were constructed to assess the usefulness of predicting cardiac deaths on an individual patient level. ROC curves were calculated by using death within eight years as a binary outcome. The variables were combined in a logistic regression function. Analyses were calculated with the SPSS (version 10.0, SPSS Inc, Chicago, Illinois, USA) computer package for Windows.
To assess whether temporal changes in the QT interval have prognostic value, in addition to absolute values, the change in QTcmax between each time point (0–3 and 3–6 years) and the mean of each QTcmax at each time point were computed. Similar variables were computed for QTD. Cox regression analysis was performed with these new variables.
RESULTS
Patient characteristics
After a mean (SD) follow up of 12.7 (3.2) years (range 1.2–17.1 years), there were 48 deaths from all causes; 26 (54%) were cardiac deaths. ECGs of 192 patients (103 men and 89 women) were analysed for QTcmax, QTD, RR variables, and ABPI measurements. We first examined the correlations between QTcmax and ABPI, QTcmax and RR parameters, and ABPI and RR parameters—in no case was there a significant correlation. Findings were similar with QTD, ABPI, and RR parameters.
Classification of deaths
Of the 26 cardiac deaths, 17 were caused by acute myocardial infarction, two were sudden deaths (both patients had myocardial infarcts in the previous year), two were unattended (both patients had myocardial infarcts in the year before their death), and five were caused by heart failure. In the non-cardiac death group, 14 deaths were malignancy related, one death was unattended (with no previous history of ischaemic heart disease), one patient died in a road traffic accident, two patients died of pneumonia, one died of liver failure secondary to haemochromatosis, and three died of fatal cerebrovascular accidents. Death classification was reasonably clear in all cases, although it is never possible to be absolutely categorical about the cause of death. The classification of cause of death in this study is believed to be as accurate as possible.
Clinical characteristics of survivors and of those who died of cardiac and non-cardiac causes were compared at baseline (table 1), three years, and six years. Participants who died of cardiac causes had a significantly longer QTcmax (and to a lesser extent QTD) at baseline, independent of age, than those who died of non-cardiac causes or those who survived. This relation was consistent over the study period. Comparison between the sexes showed QTcmax to be significantly higher in women than in men at each assessment (table 2). This difference was also found to be consistent when assessed within subgroups, except for those who died of non-cardiac causes. QTD, however, was not significantly different between the sexes (table 2).
Those who died (both cardiac and non-cardiac causes) tended to be older. Pulse pressure was found to be significantly higher in those who died, as was systolic blood pressure (except at baseline where no significant difference between groups was found). ABPI at three years was significantly reduced in those who died of a cardiac cause. Similarly, RR ratio at six years was significantly higher in the same group.
In addition, we compared the available risk factors (table 3) between patients with (⩾ 480 ms) and without (< 480) significantly raised QTcmax at entry into the study. The mean age was 51.42 years in the group with QTcmax < 480 and 54.23 years in those with QTcmax ⩾ 480 ms; this difference was found to be significant. Smoking, hypertension, and a family history were not significantly different, however. As explained earlier serum cholesterol was not measured in this trial. In our initial analysis of the data reported earlier,14 age was found to be a predictor of death, but QT interval was also found to be a predictor independent of age. Hence, this correlation with age is unimportant and furthermore it is an unchangeable predictor, whereas it may therapeutically be possible to shorten QT (for example, by increasing serum potassium).
Temporal changes in QT interval and its relation to cardiac mortality
The mean of each QTcmax was a highly significant predictor of cardiac mortality at all time points (mean at 0–3 years, χ2 = 28.16, p < 0.001; at 3–6 years, χ2 = 17.16, p < 0.001) However, the change in QTcmax between each time point did not predict cardiac death (change at 0–3 years, χ2 = 0.91, p = 0.340; at 3–6 years, χ2 = 3.248, p = 0.07). Findings were similar with mean QTD and change in QTD (mean at 0–3 years, χ2 = 17.12, p < 0.001; at 3–6 years, χ2 = 19.08, p < 0.001; and change at 0–3 years, χ2 = 0.51, p = 0.477; at 3–6 years, χ2 = 1.12, p = 0 .291).
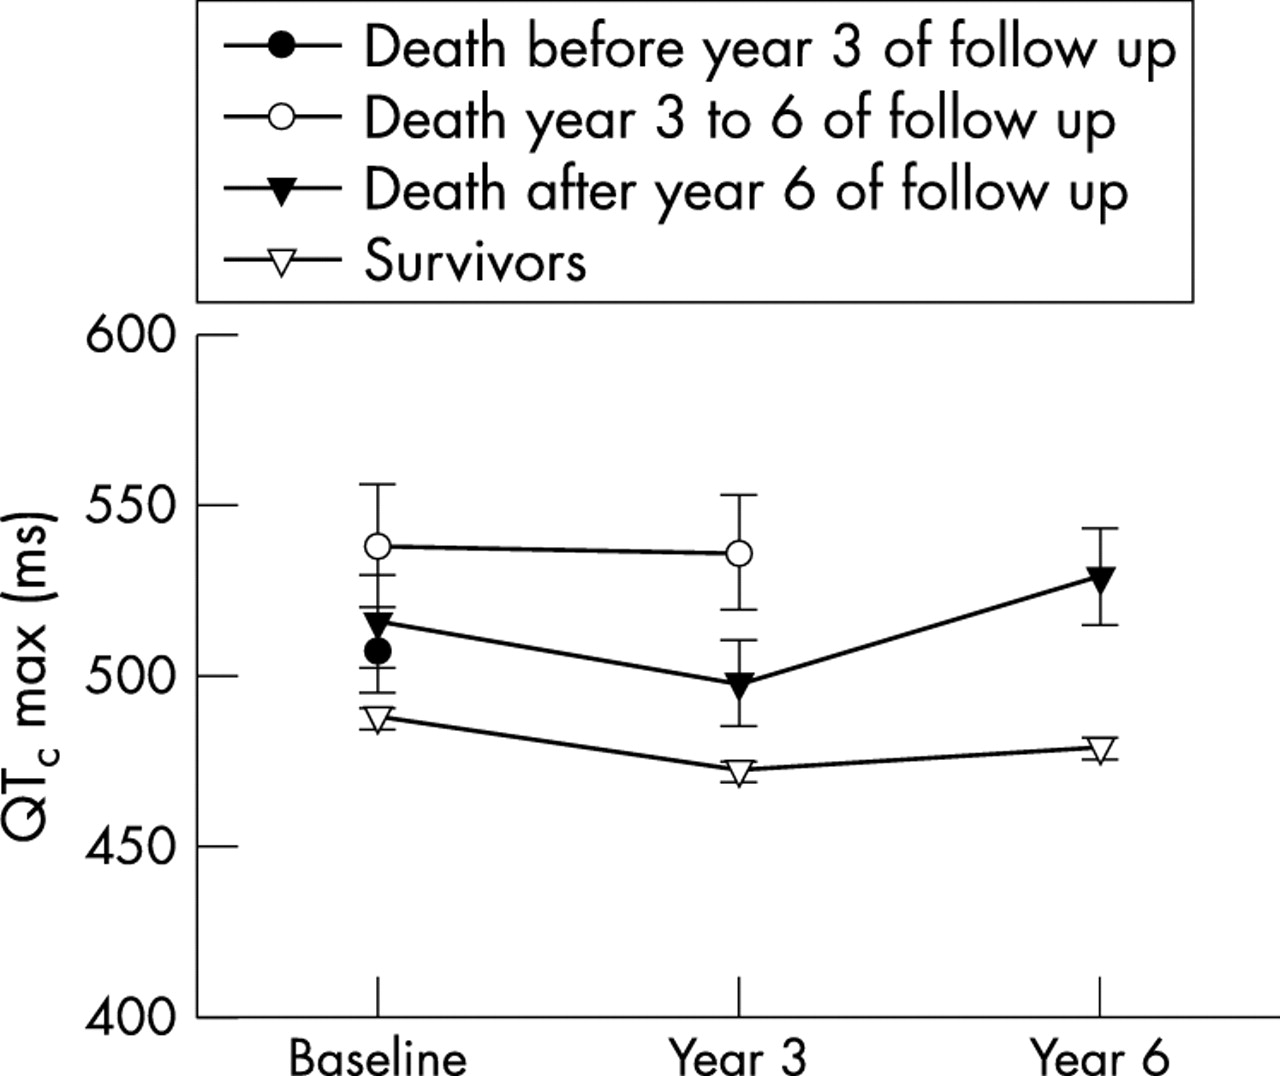
Figure 1 illustrates the mean QTcmax at baseline, three, and six years for survivors and compares this with the group died of cardiac causes.
Thus, for QTcmax and QTD it is the mean value that is important in predicting cardiac death, rather than the change in QTcmax or QTD over time. On final analysis, it appears that QTcmax and QTD are abnormal from the outset (in this case from the time of diagnosis of non-insulin dependent diabetes in this population) and remain so in patients who are at greatest risk of cardiac death.
Comparison of QTcmax and QTD with RR and ABPI variables as predictors of cardiac death
In univariate analysis, QTcmax and QTD were both significant predictors of cardiac death. In univariate analysis systolic blood pressure was also a significant predictor. ABPI was predictive only at three years and RR ratio was predictive only at six years. RR interval did not predict cardiac death (table 4). In stepwise Cox regression analysis, QTcmax and systolic blood pressure were independently predictive at baseline, QTcmax and ABPI were independently predictive at three years, and QTcmax and RR ratio were significantly predictive at six years (table 5). Therefore, QTcmax was independently predictive at all three time points when considered in a stepwise Cox regression analysis along with age, sex, blood pressure, cardiothoracic ratio, serum glucose, creatinine, sodium, potassium, family history, smoking, and antihypertensive treatment.
Table 5 also shows whether ABPI or the RR parameters can improve the ability of QTcmax to predict cardiac death by using a multivariate Cox regression analysis. The predictability of QTcmax was improved at three years (χ2 = 6.40, p < 0.05) by the addition of ABPI; interestingly, this added predictability was not significant at six years (χ2 = 0.005, p = 0.95). At six years, the RR ratio improved the ability of QTcmax to predict patients most at risk (χ2 = 5.96, p < 0.05). Findings were similar when QTcmax was replaced in the analysis by QTD.
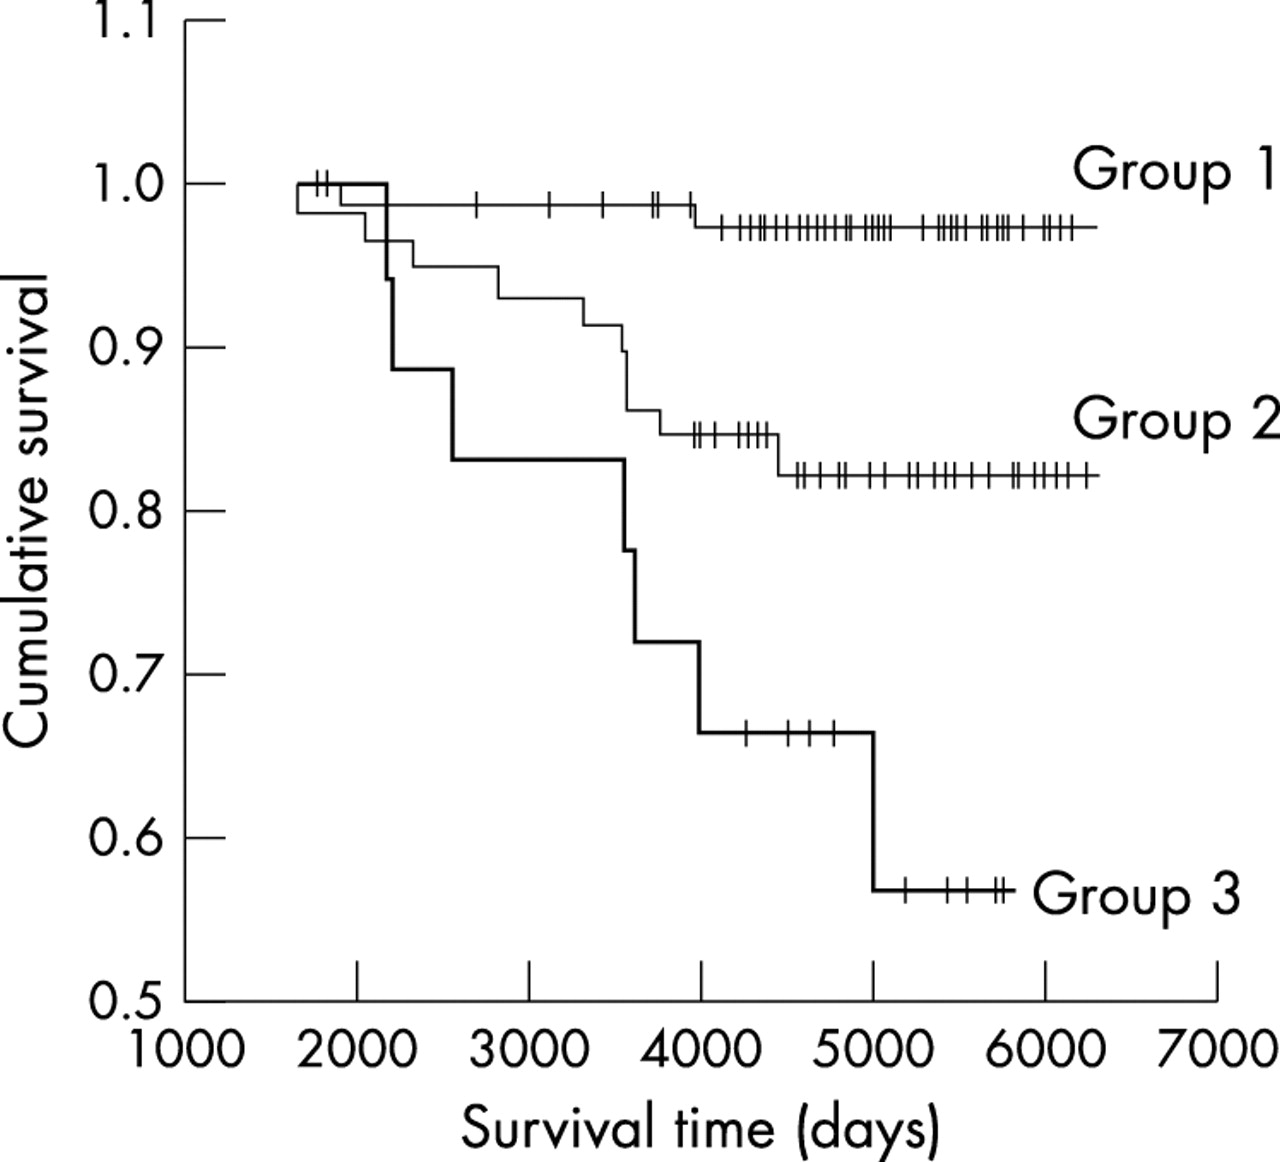
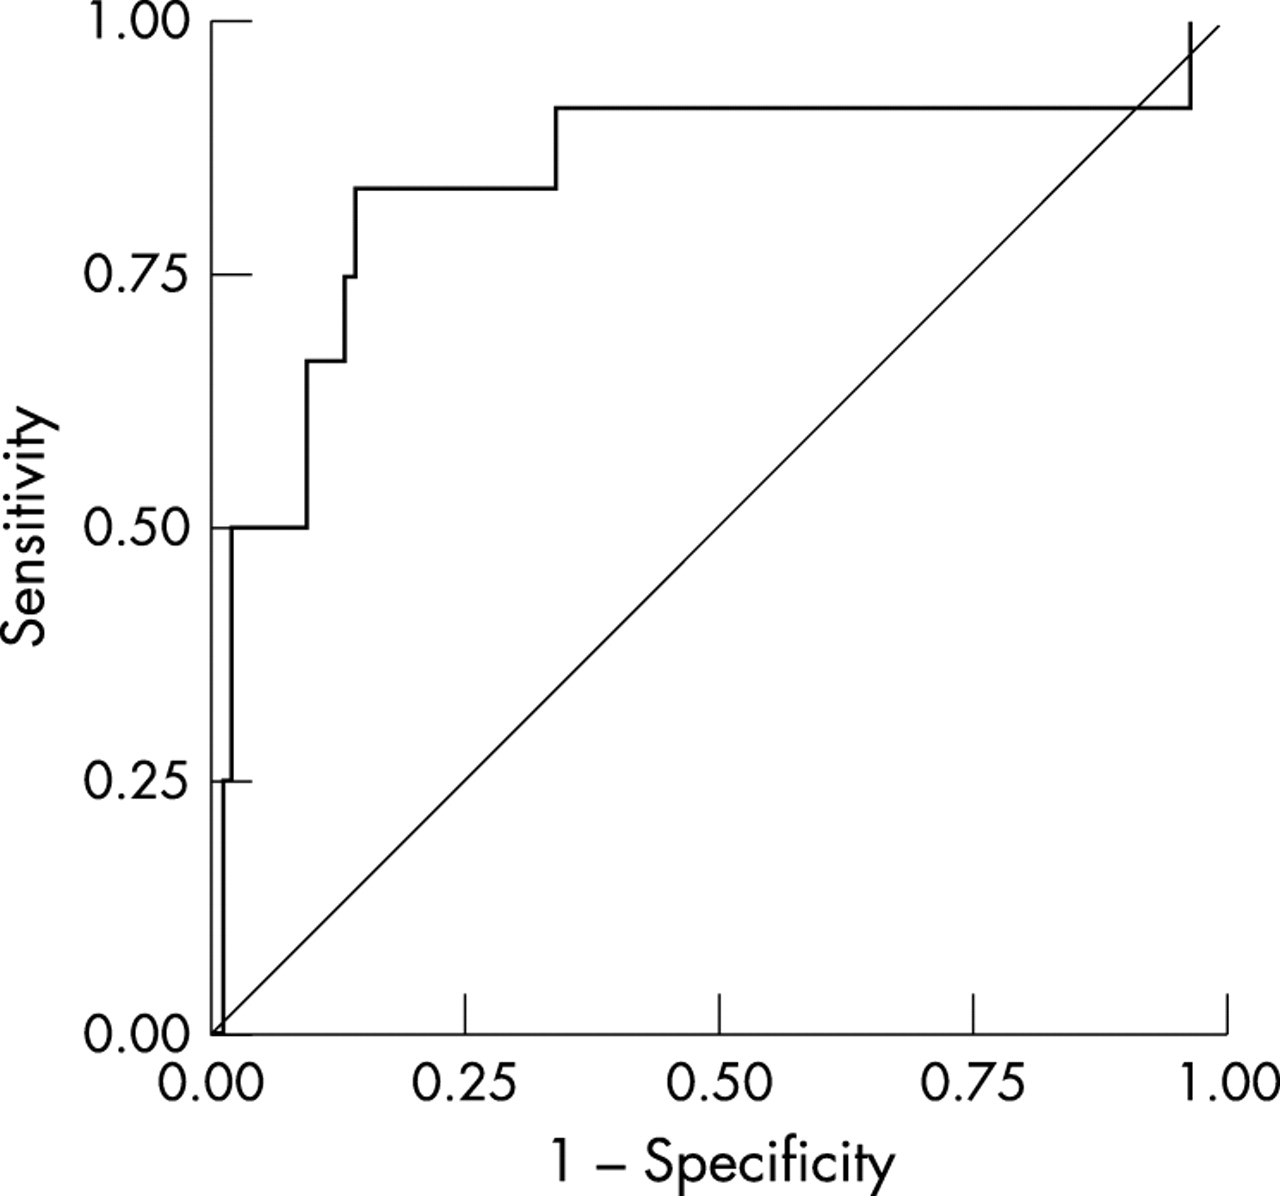
Figure 2 shows Kaplan Meier survival analysis and illustrates the performance of QTcmax at baseline in its ability to predict death. Figure 3 and table 6 show ROC curve analysis. The area under the ROC curve for QTcmax with RR ratio and ABPI was less than the area for QTcmax alone. Calculating the ROC curves required the exclusion of some patients with incomplete data, which may explain why there are some small differences between the Cox regression analysis and the ROC curve analysis. Table 6 shows selected sensitivities and specificities of these variables alone and in combination. QTD was also analysed and results were similar to those for QTcmax.

Receiver operating characteristic (ROC) curve of QTcmax in predicting cardiac death in diabetes at six years (area under the curve is 0.84).
DISCUSSION
The first finding from this study was that QTcmax and QTD predicted which patients were at greatest risk of cardiac death with reasonable accuracy. However, these particular findings were no surprise and were previously published in an earlier analysis of the same patient cohort.14 However, this was several years ago, and survival has since been updated (mean (SD) follow up in our earlier analysis was 10.3 (1.7) years with 32 deaths (19 cardiac)). The increased number of deaths increases the statistical strength of the analysis and lends further weight to the belief that QT variables have a potential place in clinical practice as a screening test for patients with non-insulin dependent diabetes who are at significant risk of cardiac death. The more novel findings in this particular analysis are described below.
QT variables
Our most conclusive finding here was that QTcmax (and QTD) is abnormal at the time of initial diagnosis of non-insulin dependent diabetes and does not progressively worsen, but instead remains abnormal in patients who subsequently die of a cardiac cause. Concomitantly, we found that patients who died of a non-cardiac cause and those who were still alive had QT intervals that were significantly lower at initial diagnosis and did not change significantly over the same period. Our findings differ a little from the strong heart study, since in the former QTcmax predicted total mortality better than cardiovascular mortality, whereas we found the opposite. This difference may be a matter of power, since only 29% of the deaths were cardiovascular (including strokes) in the strong heart study, whereas 54% of deaths were cardiac in our study. In addition our study population consisted entirely of patients with non-insulin dependent diabetes, who are at risk of premature cardiac death, whereas the strong heart study incorporated such patients but also those without diabetes. Our results here suggest that the main factors leading to cardiac death in diabetes are established very early on. This is even compatible with the view that genetic influences on the QT interval may be more important in determining prevailing QT abnormalities than the acquired subclinical cardiac disease, which the diabetic patient clearly develops over time. Another explanation relates to the observation that hyperinsulinaemia, which is present before the diagnosis of diabetes, can be associated with an abnormally prolonged QT interval. This may arise because hyperinsulinaemia causes sympathetic activation, which in turn enhances myocardial cell membrane refractoriness.19,20 This may be the basis for fatal cardiac arrhythmias. Conversely, it may be that the syndrome of insulin resistance is linked with the early development of subclinical coronary artery disease and QT interval is an early sensitive (and non-invasive) manifestation of this. To explore the role of hyperinsulinaemia in its association with QT length further future studies would need to include measures such as serum leptin, percentage body fat, and body mass index.21 Whatever the cause, our finding that QT interval is abnormal early on in diabetes has important implications and merits further study.
Sex differences in QT variables
Our findings that QT parameters were significantly higher in the female study population is in keeping with other studies of non-insulin dependent diabetes. Sawicki and colleagues15 found that QTD was significantly longer in women (148 women, 68 men, 74 ms v 64 ms, respectively; p = 0.042). This observation may relate to hormonal influences on QT duration.22
Significantly prolonged QT variables in this study
In our study a significant proportion of patients at entry into the study had a prolonged QTcmax and QTD. This has been reported in other studies. Christensen and colleagues23 found QTcmax > 440 ms in 67% and QTD > 50 ms in 51% of 324 patients. Non-insulin dependent diabetes is associated with a spectrum of conditions, including hypertension, lipid abnormalities, autonomic neuropathy, and diabetic cardiomyopathy. These conditions are known to adversely affect QT interval. If these effects are additive then an increase in QT interval is not surprising. Certainly, similar degrees of QT prolongation were recently reported by Christensen and colleagues.23 Their white patients with non-insulin dependent diabetes had a median QTcmax of 454 ms (range 376–671 ms) and a median QTD of 61 ms (range 0–240 ms). Factors that may falsely prolong QT duration such as U waves were excluded in our analysis. Female patients tended to have more prolonged QT parameters. Hence, discrepancies in QT duration may in part be accounted for by the large sex differences seen here and in other studies on QT interval length. It could also be that these data come from the early 1980s, when important beneficial treatments were unavailable, such as revascularisation procedures and angiotensin converting enzyme inhibitors, both of which shorten QT interval.
QT variables and their association with cardiovascular disease and death
QTcmax and QTD may reflect different aspects of abnormal ventricular repolarisation. Not surprisingly, they correlate strongly with each other, both being derived from the same parameters on the surface ECG. Our data found both to be predictors of cardiac death, QTcmax being the better of the two. The discrepancy in their consistency to predict such events in other studies probably reflects the varying populations studied and perhaps the types of events regarded as end points. For example, we did not use cerebrovascular events as an end point, whereas the strong heart study did include stroke.13 Furthermore, the population studied included a majority of non-diabetic individuals. The study found QTc max to be a strong predictor of all cause death and a weaker predictor of cardiovascular mortality, whereas QTD was a predictor of cardiovascular death only. It may be that QTD and interval duration are altered to differing degrees by different disease processes. Thus, in the case of non-insulin dependent diabetes, where several disease processes may be influencing myocardial depolarisation and repolarisation duration, we see a different characteristic in these parameters. Perhaps we can lessen the confusion between the two variables by defining their characteristics in different disease states.
Ankle brachial pressure index
The question of whether the ability of QTcmax to predict cardiac death can be further improved by the addition of other non-invasive bedside tests was less conclusive. ABPI is thought to reflect the extent of atheromatous disease, including the degree of coronary artery disease. At three years ABPI was found to add predictive value. However, this apparent significance was lost at the six year follow up. This finding is likely to reflect the inherent problems associated with serial measurements of ABPI,24 whose natural history shows a bimodal progression with increasing severity of disease (that is, as peripheral vascular disease develops, the ABPI falls below 1.0, but when the vessels calcify at a later stage, the ABPI begins to increase, often to values much greater than 1.0). Emanuele and colleagues25 studied the progression of vascular disease in diabetic patients (n = 28) with past or evolving gangrene, by using ABPI. They found that ratios above 1.10 were invariably associated with heavy calcification of vessels. Lesser degrees of arterial calcification had normal or depressed ratios. They concluded that such calcification may be causally related to the abnormally increased leg systolic pressures commonly seen in diabetic patients. Their study was prompted by the observation that diabetic patients with peripheral vascular disease tended to have higher ABPIs than their non-diabetic counterparts.26–29 Thus, the usefulness of serial ABPI measurements is called into question and needs to be further scrutinised for its appropriateness in diabetic patients. If we were able to establish accurately where the patient is in the development of peripheral vascular disease, a single reading of ABPI in time may prove useful. However, in clinical practice this is not usually the case.
RR variables
RR variables as a measure of autonomic function did not either alone or in combination with QT variables significantly predict (or improve prediction of) cardiac deaths, except after six years from entry into the study (standing heart rate, RR ratio). Previously published studies have shown that autonomic dysfunction (using a variety of tests including the non-invasive five Ewing tests) in diabetic patients is associated with an increased risk of cardiac death.30,31 In our study only two autonomic function tests were performed and assessed singularly, whereas a combination of the five Ewing tests is considered ideal,32 being a more balanced reflection of parasympathetic and sympathetic nervous system function. Thus, the findings in our study may have resulted from the limited autonomic function testing available to us, and combining the two tests may have partially circumvented this limitation. However, it should be said that use of the five Ewing test combination has not become routine in all diabetes clinics. The simplified RR tests used here would be much more user friendly had they been significant predictors of death sufficient to enter into clinical practice. Clearly, this does not appear to be the case. It may also be that more overt autonomic dysfunction becomes evident only at a short time before death. If this were the case it would not be an appropriate early and sensitive marker of subclinical cardiac disease.
It is worth emphasising that our study assessed the relative performance of each test against other tests rather than each test’s absolute performance. In this regard ABPI and autonomic function testing do not appear to be superior to testing of QT parameters in identifying patients at risk at an early stage. ABPI added predictive value to the QT parameters at three years after diagnosis of diabetes, as did standing heart rate (RR ratio) at six years, although these benefits appeared to be marginal. However, ABPI and autonomic function tests may be significant predictors in a study with more events.
The use of QT interval abnormalities to predict cardiac death has attracted controversy because of their sometimes poor interobserver reproducibility. Methodological concerns are especially problematic in patients with frankly abnormal ECGs caused by established severe cardiac disease, where defining the end of the T wave is difficult. These methodological concerns are much less important in patients, such as in this study, where the ECGs are generally morphologically normal or only mildly abnormal. If QT interval measurements can be refined and better standardised their acceptance in clinical practise as a screening test in selected populations may allow for early detection and intervention to prevent such deaths.
The prospect now arises that QT parameters may be used in clinical practice to risk stratify diabetic patients in order to target cardiac investigations and treatments where necessary. A cut off value (for example, QTc at six years > 510 ms) with good sensitivity and specificity for cardiac death can be chosen at which patients with a prolonged QTc should undergo echocardiography, exercise testing, and electrophysiological testing to detect reversible cardiac abnormalities (such as left ventricular dysfunction, reversible coronary ischaemia, and malignant arrhythmias). This may lead to intensified treatment with statins, coronary revascularisation, or insertion of implantable cardiac defibrillators in selected cases. Whether such an overall strategy would lead to a cost effective reduction in cardiac deaths in diabetes obviously would need to be assessed, but it seems to be a strategy worth investigating further.
Our study had some unexpected findings. QT parameters retained their prognostic value despite current medical treatment, whereas blood pressure lost its prognostic value over time in multivariate analysis. We would have expected blood pressure to be strongly predictive of cardiac death; systolic blood pressure at entry was significant but not thereafter (table 5). A possible explanation was that as part of the UKPDS cohort, patients with hypertension underwent medical lowering of blood pressure.33,34 Alternatively, as cardiac disease progressed, left ventricular damage may have led to a lower blood pressure and hence loss of the normal relation between a high blood pressure and cardiac death.
In conclusion, QT interval analysis is superior to ABPI and RR interval analysis in identifying diabetic patients who are at high risk of a cardiac death. Intriguingly, abnormal QT interval seems to exist at the point of diagnosis of diabetes and does not appear to worsen between then and death. The way is now open to perform a trial to see whether risk stratification with QT interval followed by intensive cardiac investigations and treatments would be a cost effective way to reduce cardiac death in diabetes.
One way analysis of variance or χ2 for all clinical values testing for overall differences between groups at baseline
QT parameters compared between the sexes at baseline, three, and six years
Risk factor distribution at entry according to QTcmax (<480 ms v ⩾480 ms)
Simple Cox regression analysis of each variable at baseline and during follow up
QTc when multiple Cox regression was performed with the addition of ABPI and RR variables
Examples of sensitivity and specificity of various cut off values for predicting cardiac death within eight years from each measurement

Comparison of maximum heart rate corrected QT interval (QTcmax) (mean value) between survivors and those who died of cardiac causes.
Kaplan-Meier survival graph of QTcmax predicting cardiac death in diabetes at three years. Group 1, QTcmax <470 ms; group 2, QTcmax 470–510 ms; group 3, QTcmax >510 ms.
Acknowledgments
B S Rana is supported by a grant from the Scottish Office and Home Health Department. We thank Philip Basset (Diabetes Research Laboratories, Oxford) for his help in updating the data.