Article Text

Abstract
With the increasing use of new regulatory tools, like the Food and Drug Administration’s breakthrough designation, there are increasing challenges for European health technology assessors (HTAs) to make an accurate assessment of the long-term value and performance of chimeric antigen receptor T-cell (CAR-T) therapies, particularly for orphan conditions, such as acute lymphoblastic leukaemia. The aim of this study was to demonstrate a novel methodology harnessing longitudinal real-world data, extracted from the electronic health records of a medical centre functioning as a clinical trial site, to develop an accurate analysis of the performance of CAR-T compared with the next-best treatment option, namely allogeneic haematopoietic cell transplant (HCT). The study population comprised 43 subjects in two cohorts: 29 who had undergone HCT treatment and 14 who had undergone CAR-T therapy. The 3-year relapse-free survival probability was 46% (95% CI: 08% to 79%) in the CAR-T cohort and 68% (95% CI: 46% to 83%) in the HCT cohort. To explain the lower RFS probability in the CAR-T cohort compared with the HCT cohort, the authors hypothesised that the CAR-T cohort had a far higher level of disease burden. This was validated by log-rank test analysis (p=0.0001) and confirmed in conversations with practitioners at the study site. The authors are aware that the small populations in this study will be seen as limiting the generalisability of the findings to some readers. However, in consultation with many European HTAs and regulators, there is broad agreement that this methodology warrants further investigation with a larger study.
- leukaemia
- health economics
- quality in health care
- paediatric oncology
This is an open access article distributed in accordance with the Creative Commons Attribution Non Commercial (CC BY-NC 4.0) license, which permits others to distribute, remix, adapt, build upon this work non-commercially, and license their derivative works on different terms, provided the original work is properly cited, appropriate credit is given, any changes made indicated, and the use is non-commercial. See: http://creativecommons.org/licenses/by-nc/4.0/.
Statistics from Altmetric.com
Introduction
Chimeric antigen receptor T-cell (CAR-T) therapy is a novel treatment for patients with acute lymphoblastic leukaemia (ALL) who have no further treatment options because of a previous postallogeneic haematopoietic cell transplant (HCT) relapse or as they have displayed no response to chemotherapy. According to recent media coverage, CAR-T treatments are being presented to the general public as a novel class of therapies with the ability to cure cancer.1 Data from the initial clinical trials of CAR-T are promising2 3 and two CAR-T therapies, tisagenlecleucel (Kymriah, Novartis) and axicabtagene ciloleucel (Yescarta, Kite Pharma), have already been approved by the US Food and Drug Administration (FDA)4 and the European Medicines Agency to treat ALL.
With the increasing use of new regulatory tools, like the FDA’s breakthrough therapy designation, there are increasing demands for European health technology assessors (HTAs) to make an accurate assessment of the long-term value and performance of CAR-T therapies from smaller datasets and shorter outcomes. In the case of the ALL treatments mentioned above, the data from accelerated approval was extrapolated from outcomes of <2 years.5 Also, ALL is an orphan indication for only 700 patients per year and the study reports submitted so far to HTAs and insurers as evidence, such as the Institute for Clinical and Economic Review (ICER) Final Evidence Report published in March 2018, concern inherently small sample sizes.
Consequently, our objective with this study was to demonstrate a methodology that harnesses a longitudinal dataset of real-world data (RWD), taken directly from the electronic health records (EHRs) of a medical centre functioning as a CAR-T clinical trial site, to allow an accurate analysis of the performance of CAR-T compared to the next-best treatment option, namely allogeneic HCT. The data were extracted from the Vanderbilt University Medical Center (VUMC; Tennessee, USA) Synthetic Derivative (SD) database,6 7 a de-identified version of live EHRs with 2.8 million patients. As this was a retrospective analysis solely based on pseudonymised US patient data, under the Health Insurance Portability and Accountability Act of 1996 (revised 2002), we were not required to seek specific consent for its use as long as the patient data were de-identified.
Although the population for this orphan indication is quite small, our approach also allowed us to mine EHR data from patients that had participated in VUMC CAR-T clinical trials, enabling us to build up a longitudinal record with a median of 3 years of outcomes, even though the therapy has only been commercially available since September 2018. This approach provides a solution to the increasing pressures being placed on HTA agencies to provide accurate and timely assessments of the effectiveness and value of treatments, given the expedited regulatory procedures and the smaller populations often found in orphan conditions with limited long-term outcomes data.
Methods
Data collection
Anonymised, subject-level information on demographics (ie, dates of birth and death, gender), diagnoses (International classification of diseases (ICD) codes), tumour histology (Surveillance, epidemiology and end results ((SEER)/International classification of diseases for oncology [ICD-O-3] tumour codes), hospital procedures (Current procedural terminology (CPT) codes based on the healthcare common procedure coding system (HCPCS)) and medicines (out-patient and in-patient), along with corresponding dates of occurrence was extracted from VUMC’s SD for the years 2012–2018.
From the EHRs of the VUMC, patients ≤25 years of age diagnosed with ALL and with their last disease measurement in year 2012 or later were identified based on at least two ICD codes for ALL from any of the ICD-9 (204·0, 204·0X) or ICD-10 (C91·0X) codes for the disease (see online tables S1 and S2 in the supplementary appendix) or on a single tumour histology code (SEER/ICD-O-3, based on tumour morphology and date of diagnosis) of 9835/3, 9836/3, 9811/3, 9812/3, 9813/3, 9814/3, 9815/3, 9816/3, 9817/3 or 9818/3 (see online table S3 in the supplementary appendix for further information on the codes used). All the medical procedures were grouped into categories to facilitate interpretation of the results (see online table S6 in the supplementary appendix).
Supplemental material
The specific data extraction used standard hospital ICD codes and basic demographic information combined with the identification of treatments known to indicate states of disease progression. It is our belief that this data-extraction methodology is generalisable to any well-maintained hospital EHR system. The approach was platform agnostic, as ICD codes could be replaced with queries using any other standard EHR code base, such as OMOP, OHDSI, MUMPS, SNOMED or SQL (Oracle).
Patient cohorts
Patients were assigned to the CAR-T cohort or HCT cohort using multiple permutations of relevant ICD-10, CPT, HCPCS and procedure coding system codes, keyword searches for CAR-T therapy, prescriptions for infusion therapies and related physician notes captured as free text in the database. Dates of CAR-T infusion were extracted from the physician’s notes. All the data and codes were extracted along with the corresponding dates of entry.
Methodology to determine relapse-free survival
One of the key challenges of using RWD on a small population such as ALL is to ensure having enough data to derive robust endpoints on the comparative effectiveness and total cost of treatment. As ICD codes do not always accurately reflect measures such as relapse, remission or a healthy state, and as the ICD code for death was only present in 25% of the patient population records in our dataset, it was necessary to develop a robust proxy for clinical effectiveness. As CAR-T and HCT are second-line ‘salvage’ treatments for ALL, the authors opted to select relapse-free survival (RFS) as a primary endpoint of the analysis. The use of surrogate endpoints, such as RFS, for comparative effectiveness assessments is common in the field of oncology.
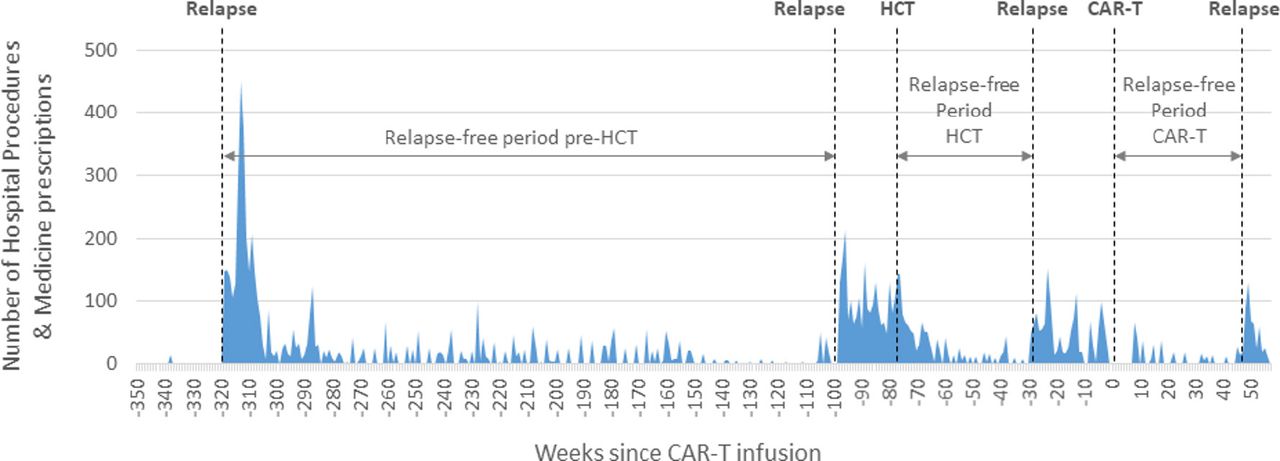
Relapse events for each patient were identified by the presence of a known ALL-specific drug therapy used for the treatment of an ALL remission, in combination with temporal points showing a marked increase in activity beyond the normal frequency of critical hospital procedures and the prescription codes seen during this phase of treatment. Drugs used to indicate the presence of ALL relapse included chemotherapeutics, such as asparaginase (and variants),8 clofarabine9 and/or other combinations of therapies indicated for relapsed and/or refractory ALL, such as novel, FDA-approved biological CAR-T therapies (blinatumomab (Blincyto, Amgen10) and inotuzumab ozogamicin (Besponsa, Wyeth Pharmaceuticals/Pfizer11)). The RFS period was calculated from the moment of the intervention that induced remission up to the following relapse (figure 1).

Relapses were identified by the sudden and marked increase in the number of hospital procedures (y axis), accompanied by a change in treatment associated with a relapse. The RFS period (x axis) was determined from the moment of intervention up to the following relapse. As CAR-T and HCT are second line ‘salvage’ treatments, RFS is considered a plausible surrogate endpoint for overall survival. CAR-T, chimeric antigen receptor T-cell; HCT, haematopoietic cell transplant; RFS, relapse-free survival.
Medicine and medical procedure costs
By linking the patient-level ICD codes to the HCPCS cost codes included in the US Centers for Medicare & Medicaid Services (CMS),12–15 a comprehensive patient-level pathway could be built, which allowed for the calculation of the comparative outcomes/effectiveness and total cost of treatment of CAR-T compared to HCT at the individual patient level.
Statistical analysis
The probabilities of RFS16 per patient were estimated by means of the Kaplan-Meier survival curves17 along with 95% CIs. Analyses were performed with the use of the data analytics software KNIME. For patients who received both CAR-T therapy and HCT, RFS analysis was done separately based on the RFS period achieved with each therapy. The net present value (NPV), or discounted cash flow, was annually discounted by 3%.
Results
Patients and treatments
Using the data-extraction criteria outlined above, 637 patients treated for adolescent ALL were identified in our 5-year retrospective query. Of these, 529 patients did not have an HCT or CAR-T procedure and were removed from our dataset. Of the remaining 108 patients with relapsed adolescent ALL who had been treated with either CAR-T and/or HCT, subjects with data gaps of ≥2 months were removed from our study in order to avoid biassing the analysis with incomplete data. Our final cohorts comprised 29 HCT subjects and 14 CAR-T subjects.
Given that the prescription records from VUMC often do not include a company-specific name for the CAR-T therapy received, we assumed that patients in the CAR-T cohort infused before September 2018 had received their CAR-T therapy as part of a clinical trial.18–20 In this capacity, we see this study as an analysis of the overall performance of the current class of CAR-T treatments for adolescent ALL, and not as an analysis of a specific company’s product.
Relapse-free survival
Patients in the HCT cohort had a substantially longer RFS period and a better RFS rate when compared with those in the CAR-T cohort. The 3-year RFS probability was 46% (95% CI: 08% to 79%) in the CAR-T cohort and 68% (95% CI: 46% to 83%) in the HCT cohort (figure 2). Given these results, this study used the EHR data to determine if there was a treatment bias in the current patients selected for treatment with CAR-T compared with those who had received HCT.

Kaplan-Meier curves and 95% CIs for relapse-free survival in the CAR-T and HCT cohorts. Data censoring (slash) represents the end of available data. CAR-T, chimeric antigen receptor T-cell; HCT, haematopoietic cell transplant.
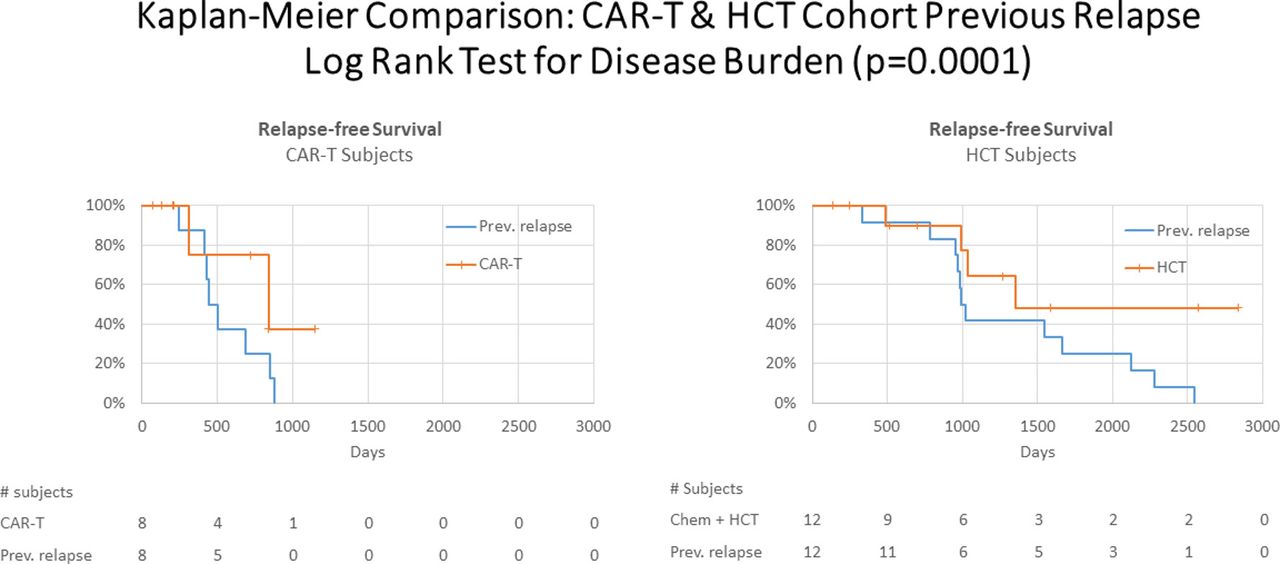
Our Kaplan-Meier curves showed that CAR-T’s 3-year outcomes were below those of HCT, which runs contrary to the results of many published CAR-T randomised controlled trial studies. We extracted further EHR data to determine if there was a selection bias or confounding variables in those patients treated with CAR-T. Even though our dataset was small, we were able to extract a subset of 8 CAR-T patients and 12 HCT patients whose records included complete RFS data on their previous first-line treatment before receiving CAR-T and HCT. What these data showed was a marked reduction in the RFS of the previous interventions of patients in the CAR-T cohort when compared with patients in the HCT cohort (figure 3). The previous RFS period in the CAR-T cohort (median, 476 days; 95% CI: 427 to 847 days) was significantly shorter than in the HCT cohort (median, 1028 days; 95% CI: 966 to 2548 days).

Kaplan–Meier curves of relapse-free survival of the CAR-T cohort (left) and the HCT cohort (right) of 8 CAR-T patients and 12 HCT patients whose preceding relapse and second-line treatment data were both available. Differences between the previous treatment responses (disease burden represented by the blue curves) were statistically tested using the log-rank test. CAR-T, chimeric antigen receptor T-cell; HCT, haematopoietic cell transplant.
As our Kaplan-Meier curves were both censored and right skewed, log-rank analysis was conducted to validate this result. The RFS period prior to CAR-T-associated or HCT-associated relapse indicated that the disease burden of the HCT and CAR-T populations was statistically different (p value <0.001). Although our dataset was limited, we were able to test the influence of patient age, average number of hospital visits per week, average amount spent on medicines and number of hospital procedures per week as factors (covariates) potentially influencing or associated with these RFS outcomes. We observed that none of these factors were correlated with pretreatment or post-treatment RFS (p values >0.8 and >0.2 in a Cox regression model). The authors assume that there are other factors, or a combination of factors, influencing RFS, and/or there is a need for a larger sample size to enable statistically relevant patient stratification and covariance analysis for the factors for which we have data. The results tables of our covariance analysis can be found in the supplementary appendix.
As HCT requires a sustained and prolonged remission before it can be administered to a patient, we hypothesised that the stem cell transplant facilities were reserving CAR-T treatment for those patients who could not sustain a remission. This hypothesis was validated and confirmed in conversations with practitioners at VUMC (see the Discussion section).
Total cost of treatment
Looking only at the internal costs within the hospital, the cost of CAR-T infusion and follow-up, excluding the actual price of the CAR-T product, is approximately 61% of the total cost of HCT, with an NPV of US$118 795 for CAR-T therapy compared with US$303 065 for HCT (table 1). However, when the price of the CAR-T therapy (tisagenlecleucel, (Kymriah, Novartis)) is also considered in the total costs, the actual CAR-T product NPV is US$579 999 (table 1). In practice, 80% of the cost of treating ALL with CAR-T therapy is due to the purchase price of the immunotherapy itself. When excluding the CAR-T product price of US$475 000, the internal hospital and medical costs of CAR-T therapy are significantly lower than those of HCT (table 1).
Total average costs of hospital procedures and medicines per patient for treating ALL with CAR-T and HCT. The CAR-T infusion period covers the time period from 8 weeks before to 6 weeks after the CAR-T infusion date; Year one data excludes infusion costs. The HCT period covers the time period from 15 weeks before to 8 weeks after the date of the procedure
Discussion
With the increasing demands being placed on HTAs in Europe, a methodology allowing for a valid assessment of the clinical effectiveness and costs for indications targeting small patient populations and orphan conditions, such as ALL, at the time of a reimbursement decision is vital. This is particularly true when the costs of these interventions are significantly high, such as in the case of CAR-T, where costs exceed US$375 000. By extracting RWD from live hospital EHRs, we were able to demonstrate a novel methodology that allows us to move beyond the use of proxies for clinical effectiveness measures extrapolated from clinical trials to obtain an assessment of the long-term outcomes and total costs of new therapies, such as CAR-T, compared with the next-best legacy treatment option.
According to a recent study by Park et al,21 having a low disease burden prior to CAR-T therapy is a strong predictor of RFS when compared with subjects with a high disease burden. The significantly longer RFS period seen in the HCT cohort in the present study indicates the likelihood that the HCT cohort had a lower level of ALL disease burden when compared with our CAR-T cohort. We have confirmed with practitioners at VUMC that our data and analysis accurately reflect the choices that are currently being made in clinical practice. Oncologists at the Vanderbilt-Ingram Cancer Center see, as of today, no evidence of CAR-T therapy being curative in the 14 patients they had treated with CAR-T. In the USA, with the current reimbursement procedures, there are tangible economic disincentives against the broader use of CAR-T therapy in patients with ALL who respond well enough to undergo allogenic HCT treatment. Thus, we have been informed in discussions with practitioners that they generally only use CAR-T when HCT is not available as a treatment option due to the lack of sustained remission.
This finding is particularly important when HTAs, such as The Dutch National Health Care Institute (Zorginstituut Nederland, ZIN), need to consider both budget impacts and societal benefits. Development of an analysis procedure utilising small sample sizes that can reliably link RWD on clinical effectiveness, disease severity and treatment cost analysis is essential for informing payers of the total cost and long-term value effectiveness compared with conventional therapy, especially in small disease populations.
A recent study22 used quality-adjusted life year (QALY) assumptions that matched the RWD calculated outcomes of the present study, and found that assuming a 0% 5-year RFS rate and with the treatment use as a bridge to transplant, tisagenlecleucel (Kymriah TM, Novartis) increased life expectancies by 5.7 years at a cost of US$184 000/QALY gained. Further, the study reported that a reduction in the price of tisagenlecleucel to US$200 000 or US$350 000 would allow it to meet a US$100 000/QALY or US$150 000/QALY willingness-to-pay threshold in all scenarios. This assessment is in line with our RWD derived costs from actual clinical practice. Also, a recent one-armed study23 investigating C-19 CAR-T therapies with a median period of follow-up of 27.1 months had a median duration of response of 11.1 months. We find that this level of response is in line with our results and further validates our methodology.
Limitations
Although our statistics are supported by p-values, we do understand that the cohort analysis could contain undetected biases due to our inability to run covariance analysis or propensity scores caused by both the small size of the dataset and the lack of hard data endpoints due to the censoring of a small test population. This may be seen as limiting the generalisability of the findings of this research to some readers. However, in consultation with many European HTAs and regulators, and given the accuracy of our findings which have been validated by clinicians at VUMC, we consider that this is a valuable methodology warranting further investigation.
Despite the limited population, this work presents a novel approach to quantifying the comparative value and effectiveness of new therapies to help meet the increasing challenges that are being faced by payers and HTAs. Our approach involves creative use of RWD providing actual, not estimated or extrapolated, cost assessments and outcomes measures of a new orphan therapy that are normally seen by HTAs as highly uncertain. The authors are currently in the process of establishing a follow-up study to validate the replicability of this methodological approach.
Acknowledgments
The authors would like to thank the VUMC and Nashville Bioscience for their contributions to this project.
Footnotes
Funding This study was funded by Zorginstituut Nederland (National Health Care Institute).
Competing interests None declared.
Provenance and peer review Not commissioned; externally peer reviewed.
Data sharing statement The anonymized patient level data used for this research are available by request.
Patient consent for publication Not required.