Article Text

Abstract
Objective To investigate the decisional impact of an age-based chart of kidney function decline to support general practitioners (GPs) to appropriately interpret estimated glomerular filtration rate (eGFR) and identify patients with a clinically relevant kidney problem.
Design and setting Randomised vignette study
Participants 372 Australian GPs from August 2018 to November 2018.
Intervention GPs were given two patient case scenarios: (1) an older woman with reduced but stable renal function and (2) a younger Aboriginal man with declining kidney function still in the normal range. One group was given an age-based chart of kidney function to assist their assessment of the patient (initial chart group); the second group was asked to assess the patients without the chart, and then again using the chart (delayed chart group).
Main outcome measures GPs’ assessment of the likelihood—on a Likert scale—that the patients had chronic kidney disease (CKD) according to the usual definition or a clinical problem with their kidneys.
Results Prior to viewing the age-based chart GPs were evenly distributed as to whether they thought case 1—the older woman—had CKD or a clinically relevant kidney problem. GPs who had initial access to the chart were less likely to think that the older woman had CKD, and less likely to think she had a clinically relevant problem with her kidneys than GPs who had not viewed the chart. After subsequently viewing the chart, 14% of GPs in the delayed chart group changed their opinion, to indicate she was unlikely to have a clinically relevant problem with her kidneys.
Prior to viewing the chart, the majority of GPs (66%) thought case 2—the younger man—did not have CKD, and were evenly distributed as to whether they thought he had a clinically relevant kidney problem. In contrast, GPs who had initial access to the chart were more likely to think he had CKD and the majority (72%) thought he had a clinically relevant kidney problem. After subsequently viewing the chart, 37% of GPs in the delayed chart group changed their opinion to indicate he likely had a clinically relevant problem with his kidneys.
Conclusions Use of the chart changed GPs interpretation of eGFR, with increased recognition of the younger male patient’s clinically relevant kidney problem, and increased numbers classifying the older female patient’s kidney function as normal for her age. This study has shown the potential of an age-based kidney function chart to reduce both overdiagnosis and underdiagnosis.
- clinical decision-making
- diagnosis
- general practice
- nephrology
Data availability statement
Data are available upon reasonable request. Data are anonymous participant questionnaire responses, and are available by contacting MG at mguppy2@une.edu.au.
This is an open access article distributed in accordance with the Creative Commons Attribution Non Commercial (CC BY-NC 4.0) license, which permits others to distribute, remix, adapt, build upon this work non-commercially, and license their derivative works on different terms, provided the original work is properly cited, appropriate credit is given, any changes made indicated, and the use is non-commercial. See: http://creativecommons.org/licenses/by-nc/4.0/.
Statistics from Altmetric.com
Summary box
What is already known about this subject?
It is well known that kidney function declines with age, and that more than half of people older than 75 years have kidney function that is currently classified as chronic kidney disease.
There are conflicting opinions about whether this represents an overdiagnosis, or whether it requires active treatment.
What are the new findings?
This study is the first of its kind in using a chart of kidney function with age to determine general practitioners’ (GPs’) assessment of a patient’s kidney function.
GPs in this study were more inclined to think an older patient’s kidney function was ‘normal’ after viewing a chart of kidney function decline with age.
The age-related kidney function chart assisted GPs to recognise problematic kidney function in a younger male patient.
How might it impact clinical practice in the foreseeable future?
The use of a ‘kidney age trajectory chart’ in this study has shown the potential to change GP classification of declining kidney function, in order to prevent both overdiagnosis and underdiagnosis.
Introduction
Chronic kidney disease (CKD) is a significant and growing problem worldwide, often existing with or preceding cardiovascular disease and diabetes.1 CKD is currently defined as an estimated glomerular filtration rate (eGFR) <60 mL/min/1.73m2 present for >3 months, irrespective of age.2 However, from a peak in the mid-20s, kidney function declines with age at a rate of about 1 mL/min/1.73m2/year.3 There are, therefore, concerns over the classification of declining kidney function in older people, and the potential for overdiagnosis.4 A persistent eGFR of <60 mL/min/1.73m2 is common in older people, with more than 40% of people over 70 years old meeting the current definition of CKD.5 One-third of people with CKD are in stage 3a (eGFR 45–59 mL/min/1.73m2), with the majority being older.4 The increased mortality risk for older patients in stage 3a is very small,6 and only a minority (<1%) of older patients with CKD will go on to have end-stage kidney disease.4 7 On the other hand, certain population groups, such as Aboriginal Australians, have higher rates of end-stage renal disease and earlier onset of CKD, associated with higher rates of cardiovascular disease and diabetes.8
Current CKD guidelines for general practitioners (GPs) do not consider patient age, with management recommendations being based on absolute eGFR cut-off values, irrespective of age.2 9 10 This may lead to overdiagnosis (the labelling of these people with disease) and overtreatment of patients who would otherwise not progress to kidney failure. Conversely, younger patients with a rapidly declining eGFR that is still in the normal range may not be recognised as having a clinical problem until their kidney function is substantially reduced.
To account for age, we propose an alternative model that allows GPs to make practical decisions about an individual patient, while considering the epidemiology of both end-stage kidney disease and cardiovascular risk. This alternative model uses a ‘kidney age trajectory chart’ as a tool to assist GPs in the diagnosis and management of patients with declining kidney function. The aim of the current study was to investigate how GPs would use an age-based chart to help interpret declining kidney function. Specifically, we hypothesised that the chart would help GPs appropriately identify patients with reduced kidney function relative to their age, according to both the current definition of CKD and whether the patient had a clinically relevant problem with their kidneys.
Methods
Development of the percentile chart
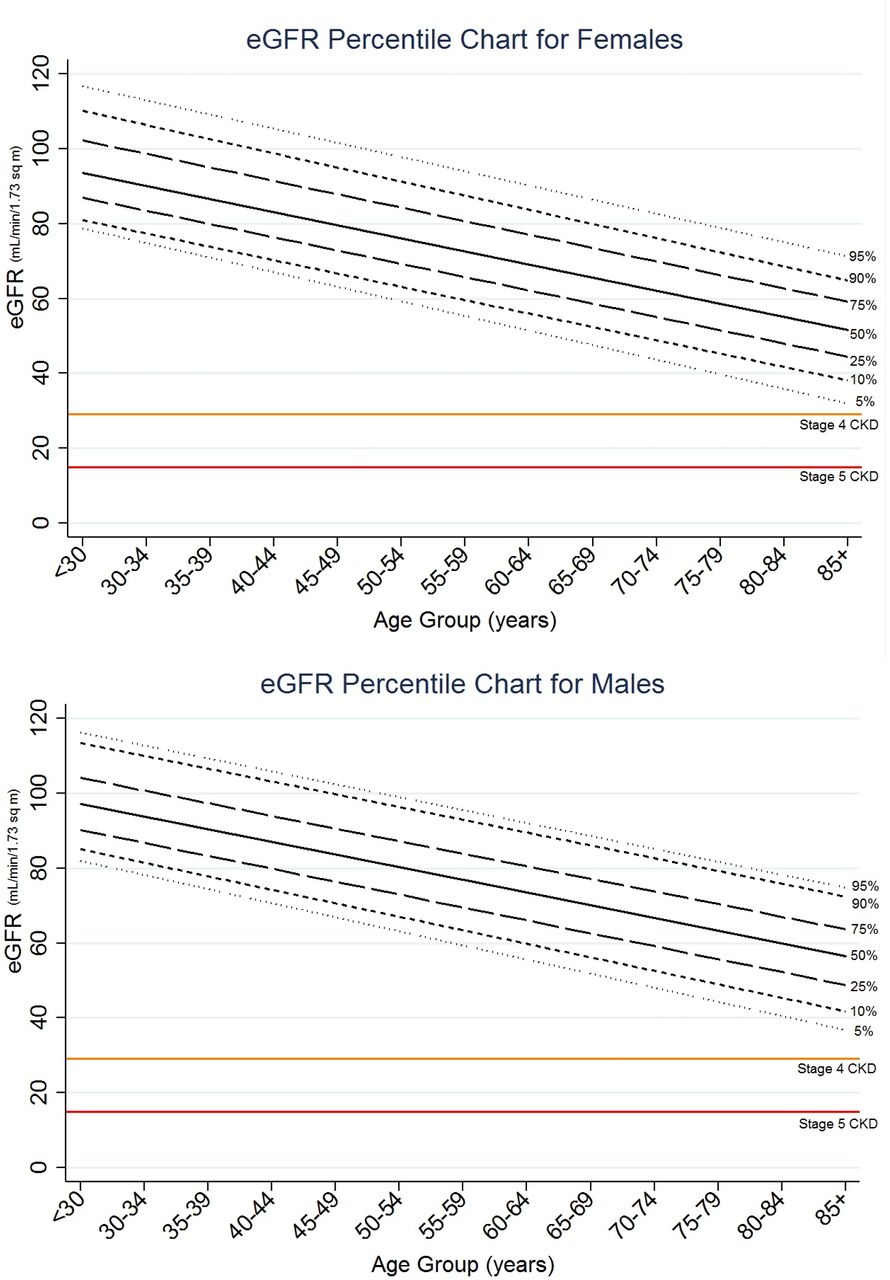
To test the hypothesis that a chart would assist GPs in interpreting the results of eGFR, we developed a percentile chart of kidney function compared with age. We used the serum creatinine data (n=11 247) from the Australian Diabetes, Obesity and Lifestyle (AusDiab) study—a cross-sectional study of 11 247 Australians drawn from the community - whose recruitment strategy and methodology has been previously described.11 12 Creatinine was used to determine eGFR using the CKD-epi equation.13 The charts were constructed from the averages seen in each 5-year age group from <30 years to >85 years. Ideally, the charts would be constructed based on individual data from prospective cohorts followed over a longer time period, but the charts developed for this study are sufficiently accurate to demonstrate if clinicians are able to interpret these data for clinical purposes. Two percentile charts, one for each sex, were graphed with eGFR in each age bracket split into percentile lines from the 95th to the 5th percentile. Stages 4 and 5 CKD were indicated on the chart, however, stages 3a and b (eGFR 45–59 mL/min/1.73m2 and 30–44 mL/min/1.73m2, respectively) were not included, as identification of these stages was included in our questions for GPs (figure 1).

Percentile charts of estimated glomerular filtration rate (eGFR) as affected by age for a random sample of 11 247 Australian male and female study participants. Current ranges for stages 4 and 5 chronic kidney disease (CKD) are indicated. Created by the authors. Permission to use.
Study design
We conducted a randomised vignette study with GPs. An electronic questionnaire using the QualtricsXM platform was sent via email to a stratified random sample of Australian GPs through a third party database (AMPCo). This is a national database, containing the mailing address of most doctors in Australia. The first component of the questionnaire was a survey on GPs’ familiarity and confidence with the Australian CKD guidelines.9 Data on age, gender, experience level, higher qualifications, practice size, specific CKD training, confidence in CKD diagnosis and management, and familiarity with the Australian CKD guidelines were collected. The second component of the questionnaire was the randomised vignette study, which is reported in this paper.
The GPs were presented with case scenarios for two different patients and asked how they would classify the kidney status of these patients. The GPs were randomised by the QualtricsXM programme to one of two groups and asked a series of questions. First, the GPs were randomised to receive the case scenarios and the kidney age trajectory charts at the same time (initial chart group), and then answered the questions about kidney status. The second group received the case scenarios without the chart, and then answered the questions about kidney status. They were subsequently given the chart and asked to respond to the same questions again (delayed chart group). They were unable to go back and view their original answers. The case vignettes were also presented to the GPs in random order.
Case scenarios
The first case was a healthy 76 year-old woman whose eGFR was 58 mL/min/1.73m2, with no albuminuria, and both these parameters had been stable for 12 months. She had no significant medical history or family history. Her lipids and glucose levels were in the normal range. She was overweight, and had borderline but stable hypertension (blood pressure (BP) 140/90 mm Hg). GPs needed to determine that her kidney function was classified as stage 3a CKD by the current standard definition, and that her eGFR was very common for her age, being on the 50th percentile (see online supplemental appendix cases).
Supplemental material
The second case was a 45 year-old Aboriginal man with an eGFR of 65 mL/min/1.73m2, which had dropped from 70 mL/min/1.73m2 1 year previously. He had no albuminuria. He was an ex-smoker, with an extensive family history of diabetes, but no significant personal medical history. He was overweight with borderline hypertension (BP 140/90 mm Hg). Information that the GPs needed to determine was that this patient did not meet the current definition of CKD, as his eGFR was >60 mL/min/1.73m2and he had no albuminuria. However, he had a number of risk factors for CKD, and it was very likely he had a significant problem with his kidney function because his eGFR was on the 5th percentile for his age (see online supplemental appendix cases).
Questionnaire
On the percentile charts, GPs were asked to plot both patients’ eGFR, and to state on which percentile line the patients’ results fell. For the initial chart group this was done prior to the questions about interpretation of the chart. For the delayed chart group this was done after they were asked to consider the scenarios a second time, in conjunction with the charts. GPs were then asked to delineate on a Likert scale whether the patients had CKD according to the ‘usual definition’. The first stages of CKD (stages 3a and b) were not indicated on the chart (figure 1). GPs were also asked to delineate on a Likert scale how likely they thought the patients had a clinical problem with their kidneys.
Outcomes
The primary outcome was the comparison between the initial chart group, and the delayed chart group’s first response (before they had seen the chart), in order to determine whether the chart caused a difference in GP responses to the following questions:
Question 1. Does the patient have CKD by the usual definition?
Question 2. Does the patient have a clinical problem with their kidneys?
We asked these very similar questions because we also wanted to determine whether GPs thought differently about CKD by its current standard definition (we report this as ‘defined CKD’), compared with what they thought might be clinically significant for a patient even if this did not meet the current CKD definition (we report this as ‘clinically relevant kidney problem’). We piloted the survey on six GPs and refined it based on their feedback, prior to wider distribution.
Secondary outcomes included whether there was a difference in the GPs’ responses to these two questions within the initial chart group and within the delayed chart group. The other secondary outcome was whether there was a change within the delayed chart group from their first responses to subsequent responses to these two questions.
We also sought to determine whether any factors such as age, gender, level of experience and correct plotting of the chart were associated with the GPs responses after viewing the charts.
Data analysis
Statistical analysis was completed using the R statistics package (R Development Core Team 2019). χ2 tests were performed on binary data, and Wilcoxon rank-sum tests (Mann-Whitney) were performed on ordinal (Likert scale) data. Proportional odds power analysis for ordinal data was used to determine the minimum total number of survey participants to be 275 assuming a power of 0.8, significance of 0.05 and assuming a conservative OR of 0.54. Likert scale data was converted from a 5-point to a 3-point scale for clarity in presentation of results. To calculate ORs, the Likert data was dichotomised, with the unsure group removed from the analysis.
Conditional inference trees were used to recursively partition ordinal responses to kidney function questions using ordinal or factorial survey responses for factors such as practitioner age, gender, experience level, higher qualifications, practice size, specific CKD training, confidence in topic, familiarity with CKD handbook9 and responses to reading the provided graph. This method was used to identify multivariate groups that have responded in significantly different ways. The Bonferroni method was used to define stop criteria with multiplicity adjusted p-values.
Results
The questionnaire was sent to 9500 GP email addresses. Four hundred and sixty-nine GPs (5%) responded to the questionnaire, and 390 participated in the randomised vignette study. Not all GPs provided an answer to all questions. GPs who did not answer all the case study questions were excluded (n=18) (figure 2). The observed findings, reported below, were similar with and without these partial respondents (data not shown). There were 190 respondents in the initial chart group and 182 in the delayed chart group. Fifty per cent of respondents were male and 50% female, with the age spread of the respondents being consistent with the age range of Australian GPs.14 Characteristics of the two groups were similar to each other, and can be seen in table 1.
Participant demographics

Consort flow diagram. Created by the authors. Permission to use. GP, general practitioner.
Case 1 (76-year-old woman)
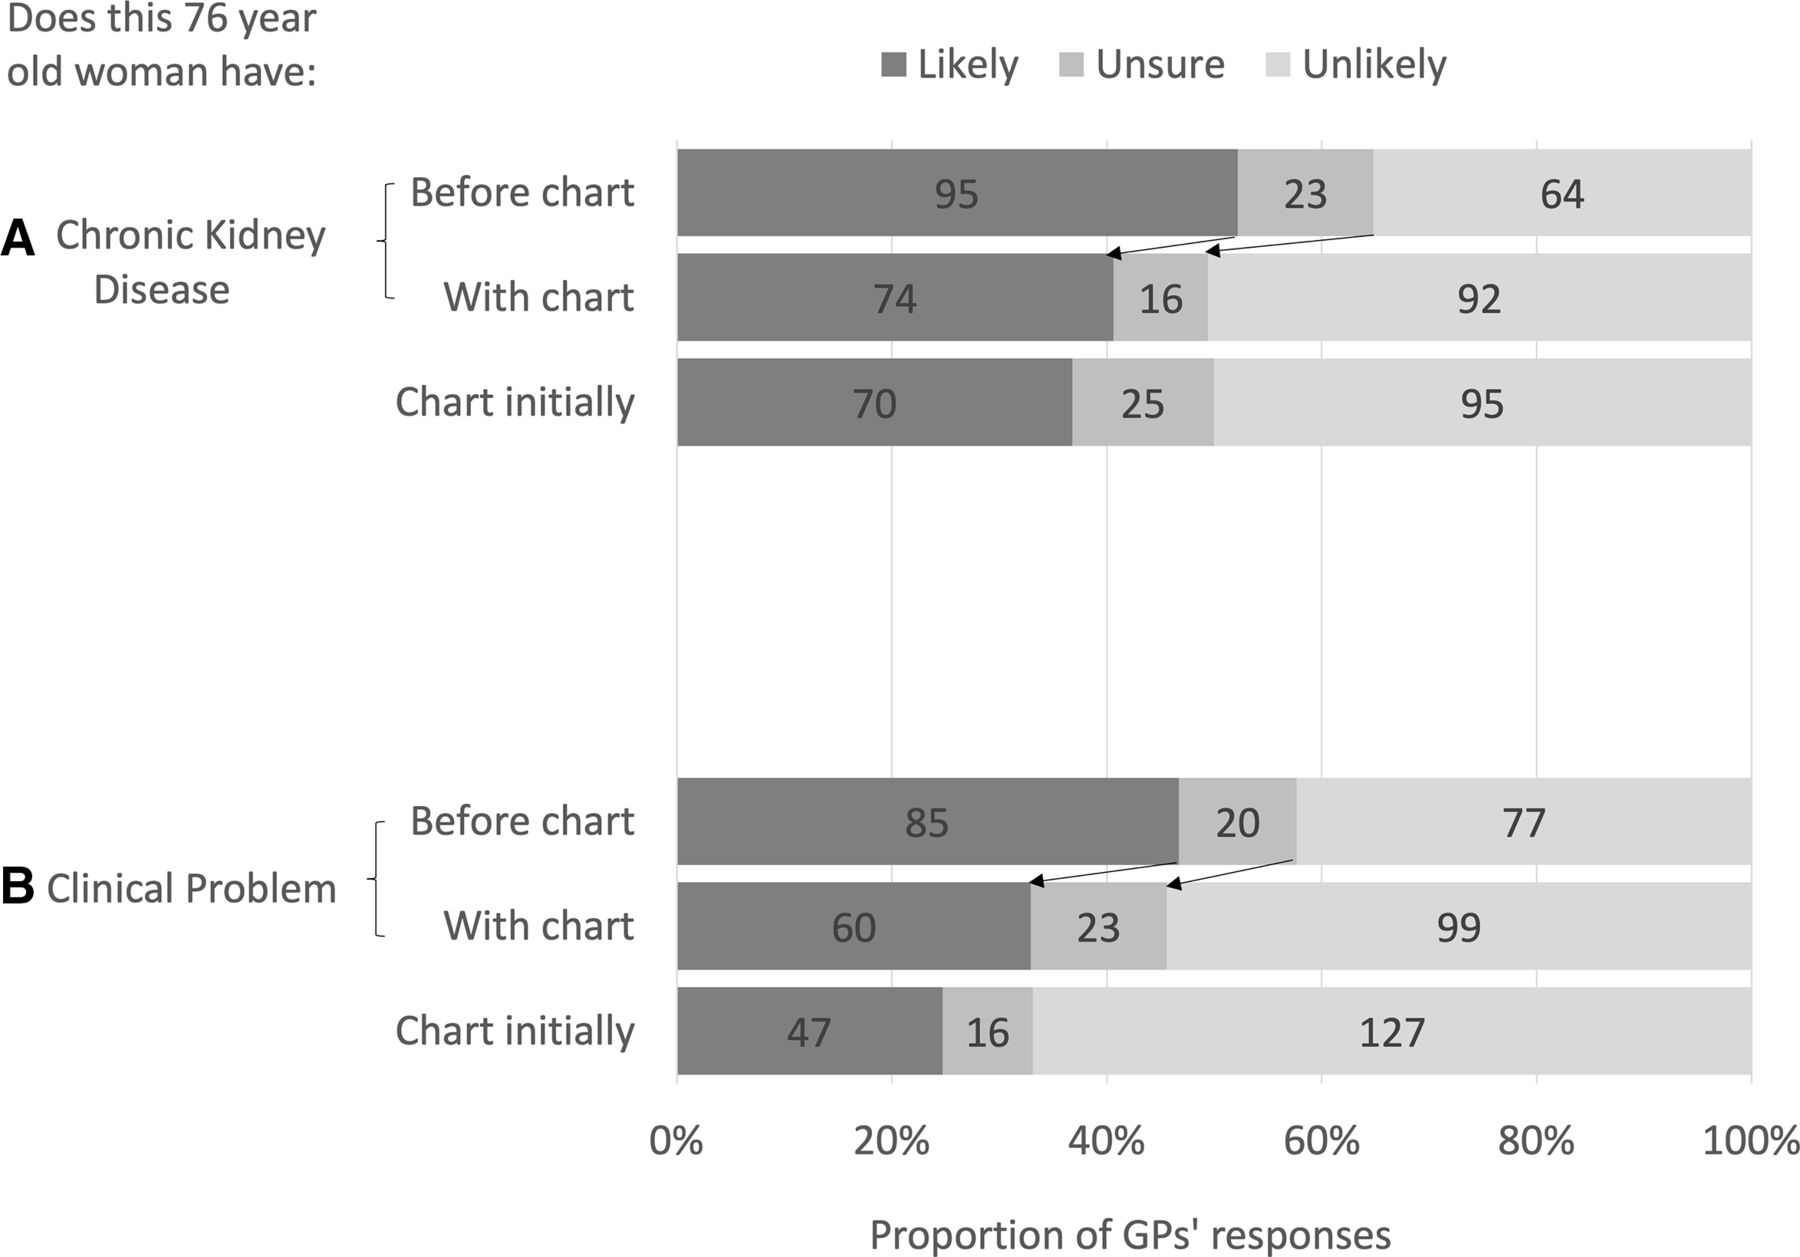
Before viewing the percentile chart, and based only on the information provided in the case study, a little more than half the GPs in the delayed chart group thought that the woman had defined CKD (52% thought it likely, 13% were unsure and 35% thought it unlikely). In contrast, GPs in the initial chart group were less likely to think she had defined CKD (37% likely, 13% unsure, 50% unlikely) compared with GPs who had not seen the chart (p<0.001 (figure 3, table 2).

Proportion of general practitioners (GPs) classifying (Likert scale) a 76-year-old woman with (A) chronic kidney disease or (B) a clinical kidney problem, before and with using a chart (delayed chart group, n=182) describing kidney function as affected by age, compared with GPs supplied with the chart initially (initial chart group, n=190). The numbers in the graph refer to the number of GPs in the groups. The arrows represent the direction of change of opinion of GPs before and with the chart in the delayed chart group. Created by the authors. Permission to use.
GP responses before viewing the chart compared to with the chart initially
In response to the second question, just under half the GPs in the delayed chart group thought she had a clinically relevant kidney problem (47% thought it likely, 11% were unsure and 42% thought it unlikely), while GPs in the initial chart group were less likely to think she had a clinically relevant kidney problem (25% likely, 8% unsure, 67% unlikely) (p<0.001) (figure 3, table 2).
After viewing the percentile chart, 15% of GPs in the delayed chart group changed their opinion about whether she had defined CKD, with 50% now thinking it unlikely she had CKD (p=0.0047). A similar proportion (14%) changed their opinion as to whether she had a clinically relevant kidney problem, with only 33% of GPs now indicating this was likely, and 54% indicating this was unlikely (p=0.0014).
Case 2 (45-year-old Aboriginal man)
Before viewing the percentile chart, based only on the information provided in the case scenario, the majority of GPs in the delayed chart group thought the man did not meet the criteria for defined CKD (21% likely, 13% unsure, 66% unlikely). In contrast, GPs in the initial chart group were more likely to think he had defined CKD (47% likely, 18% unsure, 35% unlikely) (p<0.001) (figure 4, table 2).

Proportion of general practitioners (GPs) classifying (Likert scale) a 45-year-old Aboriginal man with (A) chronic kidney disease or (B) a clinical kidney problem, before and with using a chart (delayed chart group, n=182) describing kidney function as affected by age, compared with GPs supplied with the chart initially (initial chart group, n=190). The numbers in the graph refer to the number of GPs in the groups. The arrows represent the direction of change of opinion of GPs before and with the chart in the delayed chart group. Created by the authors. Permission to use.
With respect to whether he had a clinically relevant problem with his kidney function, GPs’ responses in the delayed chart group were evenly distributed before the percentile chart was viewed (47% thought it likely, 9% were unsure and 44% thought it unlikely). In contrast, more of the GPs in the initial chart group thought he had a clinically relevant problem with his kidneys (72% likely, 9% unsure, 19% unlikely), compared with the GPs in the delayed chart group who had not seen the chart (p<0.001) (figure 4, table 2).
After viewing the chart, 42% of GPs in the delayed chart group changed their opinion to state he had defined CKD (p<0.001). Thirty-seven per cent of GPs in the delayed chart group changed their opinion to indicate he was also likely to have a clinically relevant problem with his kidneys (p<0.001). The proportion of GPs who thought he was likely to have a clinical problem with his kidneys was higher than those who thought he was likely to have defined CKD (84% vs 62%, p<0.001).
An analysis of demographic factors associated with the GPs’ responses for both groups, revealed that there was no association between their responses and the following factors: age, gender, length of practice, number of GPs at the practice, qualifications, CKD training, guideline familiarity and confidence in CKD management. The only factor which grouped significantly different responses was whether they plotted the chart correctly (including after viewing the chart for the delayed chart group). For case 1, on receiving the chart, the proportion of GPs across both the initial and delayed chart groups who plotted the chart correctly (stating she was nearest the 50th percentile) was 68%, with an additional 19% stating she was nearest the 25th percentile. The proportion plotting the chart correctly was equivalent in each group (table 1). For case 2, on receiving the chart, 86% of GPs (across both the initial and delayed chart groups) plotted the chart correctly, stating he was nearest the 5th percentile. The proportion plotting the chart correctly was equivalent in each group (table 1). GPs who plotted the chart correctly were less likely to think case 1 had defined CKD, or a clinically relevant kidney problem. For case 2, GPs who plotted the chart correctly were more likely to think he had defined CKD and a clinically relevant kidney problem.
Discussion
This study has shown that GPs who use a ‘kidney age trajectory chart’ are more likely to classify an older patient as non-diseased compared with GPs who do not use the chart. It has also shown that GPs who have access to the chart are more likely to correctly identify a clinical problem in a younger person who does not meet the standard definition for CKD. This study suggests that chart use has the potential to improve the identification of patients who may otherwise be underdiagnosed for kidney disease, as well as helping to prevent the overdiagnosis in the case of an older patient with mild reduction of kidney function.
In the case of the older woman, use of the chart changed GPs from being equivocal about whether she had a clinically relevant problem with her kidneys, to thinking she was less likely to have a clinically relevant problem. Use of the chart also resulted in half of the GPs thinking she did not meet the definition of CKD. This patient did in fact meet the current definition of stage 3a kidney disease. However, this information was not explicitly available to GPs on the percentile chart. There is debate as to whether an older patient with stable or a mild reduction in kidney function should be diagnosed with CKD, or whether this is an overdiagnosis that should instead be considered as age-related decline.4 6 The finding that half the GPs thought she was unlikely to have defined CKD, and that a majority thought she was unlikely to have a clinically relevant problem with her kidneys shows the potential for an age-related chart to prevent labelling her with a disease that is unlikely to have any significant clinical effects. This perception of GPs as to her non-diseased state warrants further exploration, including how this affects their surveillance and management of the patient. Important considerations would include how frequently they would review the patient, whether they would refer her to a nephrologist and how they consider medication prescription in older people.
In the case of the young Aboriginal man, relying on the current definition of CKD might inhibit recognition of his clinically significant decline in kidney function. If the GPs knew the current definition of CKD, then they should have stated that the man was unlikely or highly unlikely to have CKD by the usual definition, because his eGFR was above 60 mL/min/1.73m2, with no proteinuria. However, given the risk factors in this patient’s history, and the fact that his kidney function had dropped by 5 mL/min/1.73m2 in 12 months, there were reasons to indicate that he might have a clinically relevant kidney problem. Only a minority of GPs recognised this based on the case history alone. Using an age-related percentile chart changed the perception of a large proportion of GPs to correctly recognise he likely had a clinically relevant decline in his kidney function.
A limitation of this study was that it was scenario-based rather than using actual clinical decisions. The chart may perform differently in the clinical environment on real patients, so this requires further research. We were trying be neutral in our language with the two questions posed to the GPs, as we were exploring the GPs’ knowledge of the current guidelines as well as their thinking about clinically relevant functional kidney loss. We did not want to lead GPs to think the cases had CKD based on our wording. This may have led to the GPs’ subjective interpretation of our terminology. We mitigated this by piloting the survey on a group of GPs and gaining their feedback prior to formally distributing the survey.
The chart was developed from cross-sectional data in the Australian population from the AusDiab study.12 Most people in the AusDiab study were Europid, and Aboriginal Australians and other ethnicities were not well represented. So, the chart used in this study may not be generalisable to Aboriginal people or other ethnicities, or applicable to other populations. Another potential limitation is that we did not define the ethnicity of the older woman in case 1 in order to focus attention on her age. Defining the older woman’s ethnicity (as we did in case 2) may have altered GPs responses. Charts based on data from multiple populations should be developed and tested. However, charts based on a racial or ethnicity correction should only be considered with caution, as ethnicity-based charts derived from populations experiencing socioeconomic inequity may unintentionally reflect the negative consequences of socioeconomic disadvantage rather than ethnic-specific factors associated with ageing kidney function.15
A proportion of GPs did not correctly plot the patients’ eGFRs onto the chart. GPs who plotted the chart correctly were less likely to think the older woman had defined CKD, or a clinically relevant kidney problem. For case 2, GPs who plotted the chart correctly were more likely to think the young man had defined CKD and a clinically relevant kidney problem. Incorrect plotting of the chart could be due to a number of factors including the design of the chart (there were minimal gridlines), or the size of the electronic device used by the GPs to view the chart (smartphone or computer screen). Further research is warranted on formats, for example, using a chart automatically plotted with a patient’s pathology report that can be tracked over time (figure 5). This would negate the effect of a GP manually plotting the chart, and could answer the question of how the chart performs in clinical practice with real patients. Automatically plotting the eGFR on the chart could potentially further improve the GPs identification of patients’ normal or problematic kidney function.

A sample patient biochemistry report with automated eGFR chart generation. Created by the authors. Permission to use. CKD, chronic kidney disease; eGFR, estimated glomerular filtration rate.
Conclusion
The use of a ‘kidney age trajectory chart’ in this study has shown the potential to change GP classification of declining kidney function, in order to prevent both overdiagnosis and underdiagnosis. Further research is warranted to determine how this subsequently affects GPs’ management decisions about patients, and trialling this chart in the clinical environment would inform how the chart performs on different patients in different clinical settings.
Data availability statement
Data are available upon reasonable request. Data are anonymous participant questionnaire responses, and are available by contacting MG at mguppy2@une.edu.au.
Ethics statements
Patient consent for publication
Ethics approval
This study received ethics approval from the Bond University Human Research Ethics Committee, protocol number RO15987. Participants gave informed consent before taking part.
Acknowledgments
The authors would like to acknowledge the general practitioners who participated in this research, the Royal Australian College of General Practitioners Research Foundation and Therapeutic Guidelines for supporting this research, and the AusDiab Steering Committee for providing data from the AusDiab study.
References
Supplementary materials
Supplementary Data
This web only file has been produced by the BMJ Publishing Group from an electronic file supplied by the author(s) and has not been edited for content.
Footnotes
Contributors MG, PG, EBeller, JD contributed to the conception and design of the study. JS and EBarr provided data for the development of the chart. MG, PG, RF analysed and interpreted the data. All authors contributed to the manuscript and approval of final version. The corresponding author (MG) acts as guarantor and attests that all listed authors meet authorship criteria and that no others meeting the criteria have been omitted.
Funding Funding for this project was received from Therapeutic Guidelines Ltd through a Royal Australian College of General Practitioners Foundation research grant. The funder did not play any role in the design, delivery or reporting of the study, and the researchers were independent from the funder.
Competing interests PG reports grants from the Australian National Health and Medical Research Council during the conduct of the study. JS reports grants from Commonwealth Department of Health and Aged Care, grants from Abbott Australasia, grants from Alphapharm, grants from AstraZeneca, grants from Aventis Pharmaceutical, grants from Bristol-Myers Squibb Pharmaceuticals, grants from Eli Lilly (Aust), grants from GlaxoSmithKline, grants from Janssen-Cilag (Aust), grants from Merck Lipha s.a., grants from Merck Sharp & Dohme (Aust), grants from Novartis Pharmaceutical (Aust), grants from Novo Nordisk Pharmaceutical, grants from Pharmacia and Upjohn, grants from Pfizer, grants from Sanofi Synthelabo, grants from Servier Laboratories (Aust), grants from the Australian Kidney Foundation, grants from Diabetes Australia, during the conduct of the study. MG received a grant from Therapeutic Guidelines Ltd to undertake this research.
Provenance and peer review Not commissioned; externally peer reviewed.
Supplemental material This content has been supplied by the author(s). It has not been vetted by BMJ Publishing Group Limited (BMJ) and may not have been peer-reviewed. Any opinions or recommendations discussed are solely those of the author(s) and are not endorsed by BMJ. BMJ disclaims all liability and responsibility arising from any reliance placed on the content. Where the content includes any translated material, BMJ does not warrant the accuracy and reliability of the translations (including but not limited to local regulations, clinical guidelines, terminology, drug names and drug dosages), and is not responsible for any error and/or omissions arising from translation and adaptation or otherwise.