Article Text

Abstract
Background and aims: Cirrhotic patients frequently undergo screening endoscopy for the presence of oesophageal varices (OV). In the future, this social and medical burden will increase due to the greater number of patients with chronic liver disease and their improved survival. In this study, our aims were (1) to identify clinical, biochemical, and ultrasonographic parameters which might non-invasively predict the presence of OV in patients with liver cirrhosis; (2) to evaluate the reproducibility of the obtained results in a different, although related, further group of patients; and (3) to assess the predictiveness of the identified rules in patients with compensated cirrhosis.
Methods: In the first part of the study we retrospectively evaluated the presence of OV in 145 cirrhotic patients, and in the second part we evaluated the reproducibility of the study results in a subsequent group of 121 patients. Finally, we evaluated these parameters in a subgroup of 145 patients with compensated disease. All 266 patients underwent a complete biochemical workup, upper digestive endoscopy, and ultrasonographic measurement of spleen bipolar diameter. Platelet count/spleen diameter ratio was calculated for all patients.
Results: The prevalence rates of OV were 61% and 58% in the first and second groups of patients, respectively. In the first part of the study, we found that platelet count, spleen diameter, platelet count/spleen diameter ratio, and Child- Pugh class were significantly different among patients with or without OV, although the platelet count/spleen diameter ratio was the only parameter which was independently associated with the presence of OV in a multivariate analysis. A platelet count/spleen diameter ratio cut off value of 909 had 100% negative predictive value for a diagnosis of OV. This result was reproduced in the second group of patients as well as in patients with compensated disease. In a cost-benefit analysis, screening cirrhotic patients according to the “platelet count/spleen diameter ratio strategy” was far more cost effective compared with the “scope all strategy”.
Conclusions: The platelet count/spleen diameter ratio is the only parameter which is independently associated with the presence of OV, and its negative predictive value is reproducible. Its use is of value even in the subgroup of patients with compensated disease, and it is also cost effective.
- oesophageal varices
- liver cirrhosis
- platelet count
- spleen diameter
- endoscopy
- OV, oesophageal varices
- NOV, no oesophageal varices
- ROC curves, receiver operating characteristic curves
Statistics from Altmetric.com
- OV, oesophageal varices
- NOV, no oesophageal varices
- ROC curves, receiver operating characteristic curves
Portal hypertension commonly accompanies the presence of liver cirrhosis, and the development of oesophageal varices (OV) is one of the major complications of portal hypertension.1 The prevalence of OV in patients with liver cirrhosis may range from 60% to 80%, and the reported mortality from variceal bleeding ranges from 17% to 57%.2–5 It is noteworthy however that variceal haemorrhage is not confined to patients with large OV although they are more likely to bleed from ruptured varices than patients with small OV.
The 1996 the American Association for the Study of Liver Disease single topic symposium stated that cirrhotic patients should be screened for the presence of OV when portal hypertension is diagnosed.6 Recently, the Baveno III Consensus Conference on portal hypertension recommended that all cirrhotic patients should be screened for the presence of OV when liver cirrhosis is diagnosed.7 Other authors have suggested repeating endoscopy at 2–3 year intervals in patients without varices and at 1–2 year intervals in patients with small varices so as to evaluate the development or progression of this feature.8,9
In order to reduce the increasing burden that endoscopy units will have to bear, some studies have attempted to identify characteristics that non-invasively predict the presence of any OV or of large OV. These studies have shown that biochemical, clinical, and ultrasonographic parameters alone or together have good predictive power for non-invasively assessing the presence of OV.10–23 Overall, the most common result of these studies was that parameters directly or indirectly linked to portal hypertension, such as splenomegaly and decreased platelet count, were predictors of the presence of OV. However, in patients with chronic liver disease the presence of decreased platelet count may depend on several factors other than portal hypertension, such as shortened platelet mean lifetime, decreased thrombopoietin production, or myelotoxic effects of alcohol or hepatitis viruses.24 On the other hand, the presence of splenomegaly in cirrhotic patients is likely the result of vascular disturbances that are mainly related to portal hypertension.25 With this in mind, in this study we used the platelet count/spleen diameter ratio as a parameter linking thrombocytopenia to spleen size in order to introduce a variable that takes into consideration the decrease in platelet count which most likely depends on hypersplenism caused by portal hypertension.
Our study was divided into two parts. In the first part of the study we attempted to identify the clinical, biochemical, and ultrasonographic parameters associated with the presence of OV in a group of 145 cirrhotic patients. We tried to avoid the biases of previous studies by performing endoscopy in a single centre and using a consistent classification of OV, by not focusing on patients with advanced disease, by using simple and commonly available parameters, and by applying multivariate analysis to parameters that were significantly associated with the presence of any OV in univariate analysis.26–28 In the second part of the study we assessed whether the criteria for the non-invasive diagnosis of OV that we identified in the first part of the study were able to reproduce its predictive ability in a different, although related, subsequent series of cirrhotic patients. Furthermore, we performed the same analyses in the subgroup of patients with compensated cirrhosis as identifying non- invasive parameters that predict the presence of OV is especially important in these patients. Lastly, we evaluated whether applying the screening policy identified in the previous parts of the study to the whole cohort of patients would be cost effective.
PATIENTS AND METHODS
First part of the study
In the first part of the study we retrospectively included 145 cirrhotic patients referred to our unit for staging of liver disease between 1 January 1998 and 31 December 2000. Patients who were not stable, and in particular those who had active gastrointestinal bleeding at admission, were not included in the study, nor were patients who had previously undergone sclerosis or band ligation of OV, transjugular intrahepatic portosystemic stent shunt, or surgery for portal hypertension. Patients taking drugs for primary prophylaxis of variceal bleeding and patients with active (less than six months of alcohol abstinence) alcohol abuse were also excluded.
A total of 103 patients were male and 42 were female (mean age 61 years (range 30–86)). Aetiology of liver cirrhosis was hepatitis C virus in 78 patients, alcohol abuse alone in 24, hepatitis B virus in 16, alcohol abuse and either hepatitis B virus or hepatitis C virus in 11, hepatitis B virus and hepatitis C virus in four, hepatitis B virus with hepatitis D virus in two, autoimmunity in two, cryptogenic in six, primary biliary cirrhosis in one, and Wilson’s disease in one. Cirrhosis was diagnosed by means of laboratory, radiological, and physical examination findings, or by liver histology in the case of absence of clear clinical signs of liver cirrhosis.
Each patient had a complete biochemical and clinical examination. All patients were classified according to Child-Pugh’s criteria.29 All underwent upper digestive endoscopy and ultrasonography of the abdomen to evaluate the presence of signs of portal hypertension (presence and degree of OV, splenomegaly, and ascites). All endoscopies were performed in a single endoscopy unit using a video endoscope, and OV were classified according to the same criteria. Briefly, OV were classified using the small and large classification,30 where small OV were defined as varices that flatten with insufflation or minimally protrude into the oesophageal lumen, while large OV were defined as varices that protrude into the oesophageal lumen and touch each other (presence of confluence), or that fill at least 50% of the oesophageal lumen. For the purpose of the study, patients were divided into two groups according to the presence/absence of OV (no oesophageal varices (NOV) v OV). Ultrasonography was carried out using an AU 570 Asynchronous (Esaote Biomedica, Genova, Italia) by an experienced operator (PB). Maximum spleen bipolar diameter was estimated by means of ultrasound scan and was expressed in millimetres (mm). Coefficient of variation for repeated measurements of this parameter was less than 2%. We calculated the platelet count/spleen diameter ratio of all patients.
Second part of the study
In the second part of the study we evaluated whether the predictive criteria identified in the first part of the study were able to reproduce their predictive ability in a subsequent different, but related, group of patients who represented the same population.
In this part of the study we included 121 patients referred to our unit for staging of liver disease between 1 January 2001 and 30 June 2002. Two of the four physicians who were part of the endoscopic staff were replaced by two other physicians due to routine turnover of endoscopists in our unit. Clinical and instrumental workup, as well as inclusion and exclusion criteria for the study, and modality of OV diagnosis and classification adopted in this second group of patients were the same as those used in patients in the first part of the study. Seventy nine patients were male and 42 were female (mean age 64 years (range 39–84)). Aetiology of liver cirrhosis was hepatitis C virus in 77 patients, alcohol abuse alone in 29, hepatitis B virus in six, alcohol abuse and hepatitis C virus in five, autoimmunity in two, and primary biliary cirrhosis in two.
Statistical analysis
The Mann-Whitney U test was used for comparison of quantitative variables while qualitative variables were compared using the χ2 test. Multivariate logistic regression analysis was performed on parameters which were significantly different in a univariate analysis between patients with NOV or OV (total bilirubin, prothrombin activity, Child-Pugh’s score, platelet count, spleen diameter, platelet count/spleen diameter ratio) in order to determine the variables independently associated with the presence of OV. Receiver operating characteristic curves (ROC curves) were applied to find the best sensitivity and specificity cut off values of the variables for the presence of OV. Moreover, they were used to identify the cut off prevalence adjusted negative and positive predictive values for the presence of OV. The validity of the model was measured by means of the concordance (c) statistic (equivalent to the area under the ROC curve).31 A model with a c value above 0.7 is considered useful while a c value between 0.8 and 0.9 indicates excellent diagnostic accuracy.32 Data are shown as mean (range) or value and 95% confidence interval (95% CI). For all analyses a p value <0.05 was considered statistically significant. Data were analysed using the SPSS package for Windows (SPSS Inc., Chicago, Illinois, USA).
RESULTS
First part of the study
Among the 145 cirrhotic patients who underwent upper digestive endoscopy, 54 were Child-Pugh’s class A (37%), 52 were class B (36%), and 39 were class C (27%). Overall, 89 patients had endoscopic evidence of OV (61%), and among these patients 29 had large OV (20%). Table 1 shows the clinical, biochemical, and ultrasonographic characteristics of the patients according to the presence of OV. No age or sex differences were observed between OV and NOV patients. OV patients had significantly higher serum total bilirubin levels as well as lower prothrombin activity and platelet count compared with patients with NOV. Spleen diameter was higher while platelet count/spleen diameter ratio was lower in patients with OV. Among patients with OV, 16 were Child-Pugh’s class A, 41 were class B, and 32 were class C (χ2=36.686, p<0.0005 v NOV patients). There were no significant differences among the various Child-Pugh’s classes with regard to platelet count, spleen diameter, and platelet count/spleen diameter ratios in patients with NOV or OV (Kruskal-Wallis test, data not shown).
Main characteristics of the 145 cirrhotic patients included in the first part of the study, divided according to the presence of oesophageal varices
Multivariate logistic regression analysis was then performed on parameters that were significantly different in the univariate analysis between patients with OV and NOV, to identify variables independently associated with the presence of OV. Platelet count/spleen diameter ratio was the only parameter independently associated with the presence of OV (odds ratio 0.527 for a platelet count/spleen diameter ratio decrease of 100 (95% CI 0.427–0.651); p<0.0001).
We then used ROC curves to assess the platelet count/spleen diameter ratio cut off with the best sensitivity and specificity for a diagnosis of OV (cut off=909, sensitivity=100% (95% CI 100–100); specificity=93% (95% CI 82–98)) (fig 1). The prevalence adjusted positive and negative predictive values for a platelet count/spleen diameter ratio ⩽909 were 96% and 100%, respectively. Moreover, accuracy of this platelet count/spleen diameter ratio cut off as evaluated by the c index was 0.981 (95% CI 0.943–0.996). Both spleen diameter and platelet count cut offs with the best sensitivity and specificity for a diagnosis of OV that were identified by means of ROC curves had prevalence adjusted positive and negative predictive values and accuracies that were lower than those of the platelet count/spleen diameter ratio (data not shown).

Receiver operating characteristic curve showing the platelet count/spleen diameter ratio cut off with the best sensitivity and specificity on the basis of the presence of any oesophageal varices.
We evaluated the consistency of the platelet count/spleen diameter ratio data in a subgroup of 22 patients. In these patients both spleen diameter and platelet count were assessed monthly for two months consecutively. Sixty eight per cent of these patients had a platelet count/spleen diameter ratio ⩽909 at the first examination. Spleen diameter remained stable while the median decrease in platelet count was 16%. We observed an increase in platelet count of three patients by 5%, 7%, and 9%, respectively, although the ratio was consistently ⩽909 in all three patients at the second evaluation.
Second part of the study
In this part of the study we evaluated the reproducibility of the predictive criteria identified in the first part of the study. Therefore, we assessed whether the platelet count/spleen diameter ratio cut off identified in the previous group of patients was able to identify patients with OV in this second group of patients. In practice, we applied the platelet count/spleen diameter ratio cut off identified in the first group of patients (that is, 909) to a second different, although related, group of cirrhotic patients who represented the same population, and calculated the respective prevalence adjusted negative and positive predictive values.
Age (mean 64 years (range 39–84)), sex (79 males and 42 females), and Child-Pugh’s classification (50 patients were class A, 51 class B, and 20 class C) of the 121 patients who represented this study population were no different from patients included in the first part of the study. Prevalences of OV (59%, 71 patients) and of large OV (16%, 19 patients) were not statistically different from patients in the first part of the study. Also, among patients included in this part of the study those with OV were predominantly found in advanced Child-Pugh’s classes (27 class A, 32 class B, and 16 class C; χ2=7.412, p=0.024 v NOV patients), as observed in the first part of the study.
Even in this group of patients, total bilirubin (2.8 mg/dl (0.4–20.5) v 1.5 mg/dl (0.4–15.1); p=0.01), prothrombin activity (68% (32–100) v 76% (42–100); p=0.005), platelet count (79 267 n/mm3 (28 000–130 000) v 121 920 n/mm3 (41 000–508 000); p=0.0002), spleen diameter (155 mm (110–230) v 121 mm (95–180); p<0.0001), and platelet count/spleen diameter ratio (518 (127–889) v 1033 (365–5080); p<0.0001) were significantly different between the two subgroups of patients (OV v NOV). When the platelet count/spleen diameter ratio cut off of 909 was applied to the data regarding this group of patients, a 71% prevalence adjusted positive predictive value and a 100% prevalence adjusted negative predictive value for the non-invasive diagnosis of OV were obtained.
Non-invasive diagnosis of OV in patients with compensated cirrhosis
Among the 266 patients included in the two parts of the study, 145 (54%) had compensated cirrhosis (that is, patients without ascites and/or hepatic encephalopathy). One hundred patients were Child-Pugh’s class A and 45 were class B. Forty five per cent of these patients had OV.
We observed that platelet count, spleen diameter, and platelet count/spleen diameter ratio were the only parameters significantly different between NOV and OV patients, although platelet count/spleen diameter ratio had the highest accuracy (c index=0.921) for identifying OV in patients with compensated cirrhosis (table 2). Sixty one per cent of patients had a platelet count/spleen diameter ratio ⩽909. Lastly, 100% of patients with a platelet count/spleen diameter ratio >909 were free from OV (prevalence adjusted negative predictive value) while 74% of patients with a ratio ⩽909 had OV (prevalence adjusted positive predictive value) (fig 2).
Platelet count, spleen diameter, and platelet count/spleen diameter ratio of the subgroup of 145 patients with compensated cirrhosis subdivided according to the presence of oesophageal varices

Dot diagram showing patient distribution on the basis of the presence/absence of oesophageal varices (OV) and a platelet count/spleen diameter ratio cut off of 909 in 145 patients with compensated cirrhosis. NOV, no oesophageal varices.
Cost-benefit analysis
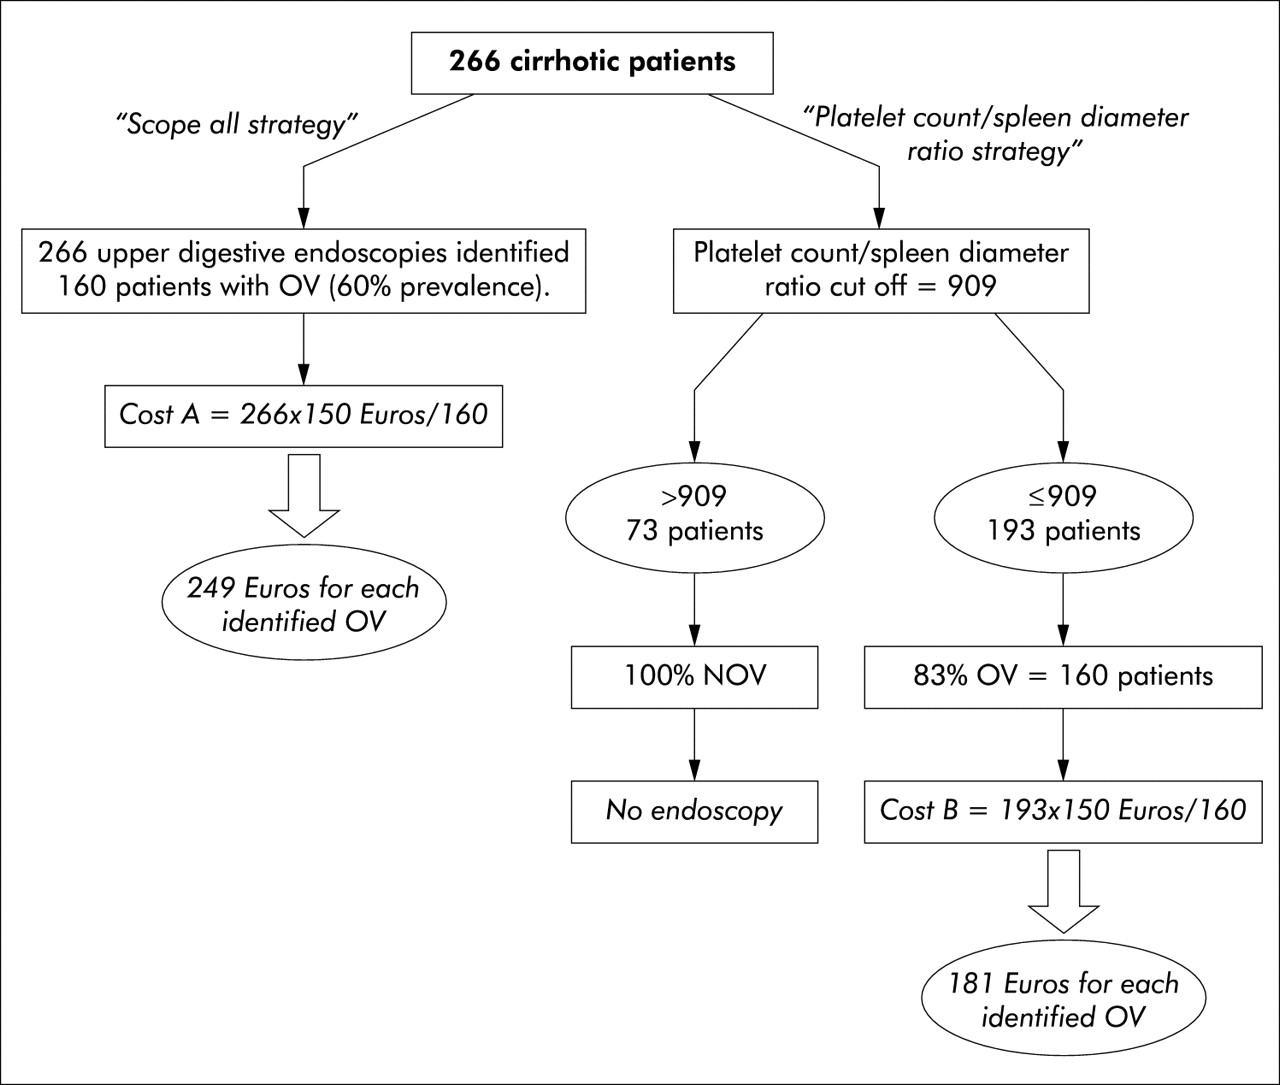
We took all 266 patients in the first and second parts of the study into consideration when performing cost-benefit analysis. Overall prevalence of OV was 60% (160 patients) while 27% of patients had a platelet count/spleen diameter ratio >909. The prevalence adjusted negative predictive value of a platelet count/spleen diameter ratio ⩽909 was 100% while the prevalence adjusted positive predictive value was 83%. We estimated the cost of diagnostic upper digestive endoscopy to be 150 Euros (fig 3) while calculating no extra cost for ultrasonographic spleen diameter measurement as cirrhotic patients usually undergo abdominal ultrasonography at diagnosis, and routinely at six month or one year intervals during follow up for surveillance of hepatocellular carcinoma.
Flow chart showing cost-benefit analysis of the “scope all strategy” compared with the “platelet count/spleen diameter ratio strategy”. A unitary cost of 150 Euros for each diagnostic upper digestive endoscopy is applied, with no extra costs for abdominal ultrasonography. The prevalence of oesophageal varices in the study population is 60%. OV, oesophageal varices; NOV, no oesophageal varices.
In this analysis, performing endoscopy on all cirrhotic patients would cost 249 Euros per patient identified with OV (“scope all strategy”). On the other hand, screening only patients with a platelet count/spleen diameter ratio ⩽909 would cost 181 Euros per patient identified with OV (“platelet count/spleen diameter ratio strategy”), would not miss any patient with OV, and would save the cost of endoscopy in a significant number of patients.
DISCUSSION
To date, seven studies have been published as full papers concerning the non-invasive diagnosis of the presence of any OV or large OV in patients with liver cirrhosis.11–17 The reason for this effort is simple: the number of patients undergoing screening for the presence of OV is likely going to increase in the near future as a result of the growing pool of patients with chronic liver disease.33,34 Therefore, there is a particular need for non-invasive predictors of the presence of OV as they might help relieve medical, social, and economic costs. Nevertheless, most of the studies concerning the non-invasive diagnosis of OV were performed on a particular subgroup of patients (that is, patients who were going to be placed on a liver transplantation waiting list) while some of the studies lacked uniformity in OV classification or adequate statistical analysis, and only one study analysed patients with compensated disease.11–14,16,17 Almost all of the studies were retrospective, although the only prospective study obtained results that were no different from those obtained in retrospective studies.15 In general, most identified decreased platelet count and splenomegaly as non-invasive predictors of the presence of OV. In our study, we considered only simple, commonly available, reproducible parameters as we believe that other features that had previously been identified as non-invasive predictors of OV were less reproducible in clinical practice,35 were subject to interobserver variability,36 or were assessed in different ways even within the same study. Moreover, we introduced a new parameter (that is, the platelet count/spleen diameter ratio). This parameter was chosen as it allows us to identify the degree of thrombocytopenia which most likely depends on hypersplenism. We measured the spleen bipolar diameter using ultrasonography as this parameter is easily obtainable, reproducible, and non-invasive, and because liver ultrasonography is routinely performed on patients with liver cirrhosis.
The distribution of the study population was homogeneous and representative of the population of cirrhotic patients seen in clinical practice, thus biases caused by selection of particular subgroups of patients were avoided. Diagnosis and classification of OV was made in the same endoscopy centre and using a single classification. We focused on the presence of any OV rather than on the presence of large OV as this is the first step in the diagnostic/prognostic workup of the patients and allows decision making processes (surveillance, repeat endoscopy at predetermined intervals, start therapy), while focusing on patients with large OV would only miss an important subset of patients requiring medical counselling. Moreover, analysis of the presence/absence of OV prevents misinterpretation of data and allows generalisation of the results.
In the first part of the study we found that parameters linked to portal hypertension (platelet count, spleen diameter) as well as those linked to liver dysfunction or advanced disease (serum bilirubin, prothrombin activity, Child-Pugh classes) were associated with the presence of any OV, as observed in previous studies. However, the original finding of our study was that a composite parameter (that is, the platelet count/spleen diameter ratio) showed very good results in discriminating between patients with NOV and those with OV.
We believe that the use of this ratio is of interest and is not redundant, and this hypothesis is supported by a number of both clinical and statistical reasons. Firstly, from a clinical point of view, platelet count may decrease for several reasons in patients with chronic liver disease.24 Thus the use of platelet count alone as a non-invasive predictor of OV can be misleading and cannot be solely attributed to portal hypertension. Indeed, the use of the platelet count/spleen diameter ratio bypasses this possible drawback since it “normalises” platelet count to splenic sequestration, most likely representing the aliquot of thrombocytopenia caused by portal hypertension. Secondly, from a statistical point of view, the platelet count/spleen diameter ratio was the only parameter independently associated with the presence of OV that was selected by a multivariate analysis which also included the single parameters.
In the second part of the study our aim was to evaluate whether the predictive power of the platelet count/spleen diameter ratio cut off identified in the first part of the study was able to reproduce its results in a subsequent different, although related, series of patients who represented the same population. Indeed, reproducibility of a clinical decision aid “requires the system to replicate its accuracy in patients who were not included in development of the system but who are from the same underlying population”.37 Under these conditions we demonstrated that the use of a platelet count/spleen diameter ratio cut off of 909 maintained its accuracy in the non-invasive diagnosis of OV. Indeed, even in the second group, all of the patients who had a ratio >909 were free from OV while 71% of patients with a ratio below this cut off had OV.
Analysis of patients with compensated disease was of particular importance. In fact, predicting the presence of OV in patients with no signs of decompensation could be especially useful and its clinical importance has recently been emphasised.5,15,23,26,28 We observed that even among patients with compensated disease, platelet count/spleen diameter ratios were significantly different between NOV and OV patients, and the platelet count/spleen diameter ratio had the highest accuracy for identifying patients with OV. Most importantly, this parameter proved to be independent of the Child-Pugh classification allowing a more confident use even in patients with compensated disease.
In this day and age, clinical decision aids must prove to be not only clinically useful but also cost effective in order to be widely accepted. In our study we showed that the use of the platelet count/spleen diameter ratio would have avoided performing unnecessary endoscopies in all patients with a cut off >909 without running the risk of not diagnosing OV. As far as cost benefit analysis is concerned, applying the “platelet count/spleen diameter ratio strategy” would lower the cost of OV screening in patients with cirrhosis (fig 3). In practice, the unitary cost per patient with OV identified during screening would be 249 Euros by applying the “scope all strategy” and 181 Euros by using the “platelet count/spleen diameter ratio strategy”. Generalising these results to the screening of 10 000 patients with liver cirrhosis per year, application of the “platelet count/spleen diameter ratio strategy” policy would save 405 000 Euros per year, and would avoid performing unnecessary endoscopies in 2700 patients. In our analysis we hypothesised no extra cost for ultrasonographic spleen diameter measurement, and this hypothesis has a solid practical basis. In fact, cirrhotic patients usually undergo annual/biannual abdominal ultrasonography as part of surveillance programmes for hepatocellular carcinoma. Therefore, follow up of cirrhotic patients to identify liver cancer allows us the opportunity to determine the platelet count/spleen diameter ratio at least annually or biannually. As the yearly incidence of OV in patients with liver cirrhosis is approximately 5%,38,39 we feel that this combined evaluation would not miss OV identification, and would be cost effective also.
Finally, this study undoubtedly has some shortcomings, such as its retrospective setting and its validation. None the less, the only prospective study performed concerning this topic obtained results that were no different from ours or from those of other retrospective studies.11–17 With regards to validation of the study, we climbed the first steps of the “reproducibility hierarchy” by using internal validation and historical transportability criteria,37 trying to avoid computer generated systems such as the jackknife cross validation method or bootstrapping technique so as to reproduce independent validation as closely as possible. However, we are also aware that only external validation will assess the usefulness of our model, and evaluate whether it can gain widespread clinical use.40 Lastly, as expected in our country, our series was skewed towards viral origin of liver disease,41 and therefore our results need to be validated in different series with a higher proportion of patients with alcohol related or cholestatic liver cirrhosis.
To conclude, the main finding of our study was that a composite parameter with biological plausibility (that is, the platelet count/spleen diameter ratio) showed the highest accuracy for non-invasively predicting the presence of OV in patients with either compensated or decompensated liver cirrhosis. The platelet count/spleen diameter ratio seems to represent an acceptable surrogate for clinically relevant portal hypertension. Applying the “platelet count/spleen diameter ratio strategy” for the detection of OV would seem to be more cost effective than the “scope all strategy”. On the basis of these data we hope that future studies will encourage other researchers to evaluate the reproducibility of the platelet count/spleen diameter ratio for the non-invasive diagnosis of OV in independent cohorts of patients with different clinical backgrounds.
REFERENCES
Footnotes
-
E Giannini and F Botta contributed equally to this work.
Linked Articles
- Letter
- Letter
- Letter