Article Text

Abstract
Background The Claim Evaluation Tools database contains multiple-choice items for measuring people’s ability to apply the key concepts they need to know to be able to assess treatment claims. We assessed items from the database using Rasch analysis to develop an outcome measure to be used in two randomised trials in Uganda. Rasch analysis is a form of psychometric testing relying on Item Response Theory. It is a dynamic way of developing outcome measures that are valid and reliable.
Objectives To assess the validity, reliability and responsiveness of 88 items addressing 22 key concepts using Rasch analysis.
Participants We administrated four sets of multiple-choice items in English to 1114 people in Uganda and Norway, of which 685 were children and 429 were adults (including 171 health professionals). We scored all items dichotomously. We explored summary and individual fit statistics using the RUMM2030 analysis package. We used SPSS to perform distractor analysis.
Results Most items conformed well to the Rasch model, but some items needed revision. Overall, the four item sets had satisfactory reliability. We did not identify significant response dependence between any pairs of items and, overall, the magnitude of multidimensionality in the data was acceptable. The items had a high level of difficulty.
Conclusion Most of the items conformed well to the Rasch model’s expectations. Following revision of some items, we concluded that most of the items were suitable for use in an outcome measure for evaluating the ability of children or adults to assess treatment claims.
- evidence based medicine
- shared decision making
- health literacy
- outcome measurement
- multiple-choice
- patient education
- Rasch analysis
This is an Open Access article distributed in accordance with the Creative Commons Attribution Non Commercial (CC BY-NC 4.0) license, which permits others to distribute, remix, adapt, build upon this work non-commercially, and license their derivative works on different terms, provided the original work is properly cited and the use is non-commercial. See: http://creativecommons.org/licenses/by-nc/4.0/
Statistics from Altmetric.com
- evidence based medicine
- shared decision making
- health literacy
- outcome measurement
- multiple-choice
- patient education
- Rasch analysis
Strengths and limitations of this study
To our knowledge, this is the first Rasch analysis of multiple-choice items that measure people’s ability to assess claims about treatment effects.
We have used robust methods to evaluate the items’ validity and reliability in two settings, allowing for evidence informed revisions.
Our analyses suggest that most items have acceptable model fit and can be used in the settings where they were tested.
The items might function differently when translated or used in other settings.
Background
People are confronted with claims about treatment effects daily. This includes claims about the effects of changes in health behaviour, screening, other preventive interventions, therapeutic interventions, rehabilitation, and public health and health system interventions that are targeted at groups of people. A ‘treatment claim’ is something someone says about whether a treatment causes something to happen or to change; for example, that vitamin C prevents you from getting common cold. A claim can be true or can be false.1–4 Many of these claims are not based on evidence from fair comparisons of treatments, and many patients and health professionals alike do not have the necessary skills to assess the reliability of these claims.5–11 Being able to think critically and make informed decisions is essential for engaging patients in clinical decisions and citizens in policy decisions.10 12–14
Interest in promoting critical thinking cuts across disciplines.15 There are many definitions and conceptualisations of critical thinking. In the learning sciences, critical thinking is defined as ‘purposeful, self-regulatory judgement that results in interpretation, analysis, evaluation, and inference, as well as explanations of the considerations on which that judgement is based’.16 There is a debate about the extent to which critical thinking skills are ‘generic’ and the extent to which they are content specific. Critical thinking is also a component of health literacy.17 In health literacy studies, critical thinking is content specific, focusing on people’s ability to think critically about health information. However, definitions of this component of health literacy are often fuzzy. They seldom describe which criteria patients should apply when thinking critically about health information.15 Critical thinking is also a key component of evidence-based practice. As in health literacy studies, critical thinking in evidence-based practice is content specific but is operationalised as practical skills such as the ability to formulate questions, find relevant research and assess the certainty of research evidence using explicit criteria.15 18 19
Efforts to promote critical thinking as a component of evidence-based practice have largely focused on health professionals. However, interest in helping patients and the public to make evidence-informed decisions is growing.11 One such initiative is the Informed Healthcare Choices (IHC) project, which aims to help people to assess treatment claims and make informed health choices. The project has developed primary school resources and a podcast series to improve the ability of children and their parents to assess claims about treatment effects. We have piloted these resources in Uganda, Kenya, Rwanda and Norway. We will test the effects of the resources in randomised trials in Uganda.20 21
The Claim Evaluation Tools database
The first step in the IHC project was to identify the Key Concepts people need to know to be able to assess treatment effects.22 This resulted in an initial list of 32 Key Concepts that serves as a syllabus for designing learning resources.22 This was also the starting point for the IHC learning resources. We present a short list of the Key Concepts in box 1. This list is hosted by testingtreatments.org and is an evolving document subject to annual revisions.
Looking for suitable measurement tools to be used in the IHC trials, we conducted a systematic mapping review of interventions and assessment tools addressing the Key Concepts.15 Based on the findings of this review, we concluded that this research is heterogeneous and that outcomes are measured inconsistently.15 Furthermore, we found no instrument that addressed all the Key Concepts or that would be suitable as an outcome measure in trials of the IHC learning resources. We, therefore, developed a database of multiple-choice items that could be used as outcome measures in the two IHC trials in Uganda as well for other purposes. The Claim Evaluation Tools database includes four or more items that address each of the Key Concepts. We developed these items in four steps, using qualitative and quantitative methods, over a 3-year period (2013–2016)23 :
Determination of the scope of the database, writing and revising items;
expert item review and feedback (face validity);
cognitive interviews with end-users—including children, parents, teachers and patient representatives—to assess relevance, understanding and acceptability; and
piloting and practical administrative tests of the items in different contexts.
Instead of a standard, fixed questionnaire, we wanted to create a database from which teachers and researchers can choose items relevant to their purposes and target groups and design their own tests or questionnaires.23 We developed all items in English, but translations are now also available in Luganda (Uganda), Norwegian, German, Spanish (Mexico) and Chinese. Currently, the database includes approximately 190 items. The items are designed to be relevant across different contexts and can be used for children (from ages 10 and up) and adults (including both patients and health professionals).23 We use ‘one-best answer’ response options in all items, with one answer being unambiguously the ‘best’ and the remaining options ‘worse’ (see figure 1 for an example of a multiple-choice item).24

Example of a multiple choice-item taken from the Claim Evaluation Tools database.
We describe the development of the items in more detail elsewhere.23 We describe here the first psychometric testing, using Rasch analysis, of items from the Claim Evaluation Tools database. The items were selected for use in an outcome measure for trials of the IHC primary school resources and podcast. The purpose of the Rasch analysis is to ensure the validity and reliability of the outcome measure.25
Key Concepts that people need to understand to assess claims about treatment effects
Informed Health Choices Concepts
1. Recognising the need for fair comparisons of treatments
(Fair treatment comparisons are needed)
1.1 Treatments may be harmful
(Treatments can harm)
1.2 Personal experiences or anecdotes (stories) are an unreliable basis for determining the effects of most treatments
(Anecdotes are not reliable evidence)
1.3 A treatment outcome may be associated with a treatment, but not caused by the treatment
(Association is not necessarily causation)
1.4 Widely used or traditional treatments are not necessarily beneficial or safe
(Practice is often not based on evidence)
1.5 New, brand-named or more expensive treatments may not be better than available alternatives
(New treatments are not always better)
1.6 Opinions of experts or authorities do not alone provide a reliable basis for deciding on the benefits and harms of treatments
(Expert opinion is not always right)
1.7 Conflicting interests may result in misleading claims about the effects of treatments
(Be aware of conflicts of interest)
1.8 Increasing the amount of a treatment does not necessarily increase the benefits of a treatment and may cause harm
(More is not necessarily better)
1.9 Earlier detection of disease is not necessarily better
(Earlier is not necessarily better)
1.10 Hope can lead to unrealistic expectations about the effects of treatments
(Avoid unrealistic expectations)
1.11 Beliefs about how treatments work are not reliable predictors of the actual effects of treatments
(Theories about treatment can be wrong)
1.12 Large, dramatic effects of treatments are rare
(Dramatic treatment effects are rare)
2. Judging whether a comparison of treatments is a fair comparison
(Treatment comparisons should be fair)
2.1 Evaluating the effects of treatments requires appropriate comparisons
(Treatment comparisons are necessary)
2.2 Apart from the treatments being compared, the comparison groups need to be similar (ie, 'like needs to be compared with like')
(Compare like with like)
2.3 People’s experiences should be counted in the group to which they were allocated
(Base analyses on allocated treatment)
2.4 People in the groups being compared need to be cared for similarly (apart from the treatments being compared)
(Treat comparison groups similarly)
2.5 If possible, people should not know which of the treatments being compared they are receiving
(Blind participants to their treatments)
2.6 Outcomes should be measured in the same way (fairly) in the treatment groups being compared
(Assess outcome measures fairly)
2.7 It is important to measure outcomes in everyone who was included in the treatment comparison groups
(Follow-up everyone included)
3. Understanding the role of chance
(Understand the role of chance)
3.1 Small studies in which few outcome events occur are usually not informative and the results may be misleading
(Small studies may be misleading)
3.2 The use of p values to indicate the probability of something having occurred by chance may be misleading; confidence intervals are more informative
(P-values alone can be misleading)
3.3 Saying that a difference is statistically significant or that it is not statistically significant can be misleading
(‘Significance’ may be misleading)
4. Considering all of the relevant fair comparisons
(Consider all the relevant evidence)
4.1 The results of single tests of treatments can be misleading
(Single studies can be misleading)
4.2 Reviews of treatment tests that do not use systematic methods can be misleading
(Unsystematic reviews can mislead)
4.3 Well done systematic reviews often reveal a lack of relevant evidence, but they provide the best basis for making judgments about the certainty of the evidence
(Consider how certain the evidence is)
5. Understanding the results of fair comparisons of treatments
(Understand the results of comparisons)
5.1 Treatments may have beneficial and harmful effects
(Weigh benefits and harms of treatment)
5.2 Relative effects of treatments alone can be misleading
(Relative effects can be misleading)
5.3 Average differences between treatments can be misleading
(Average differences can be misleading)
6. Judging whether fair comparisons of treatments are relevant
(Judge relevance of fair comparisons)
6.1 Fair comparisons of treatments should measure outcomes that are important
(Outcomes studied may not be relevant)
6.2 Fair comparisons of treatments in animals or highly selected groups of people may not be relevant
(People studied may not be relevant)
6.3 The treatments evaluated in fair comparisons may not be relevant or applicable
(Treatments used may not be relevant)
6.4 Results for a selected group of people within fair comparisons can be misleading
(Beware of subgroup analyses)
Objective
To assess the validity, reliability and responsiveness of multiple-choice items from the Claim Evaluation Tools database, using Rasch analysis, in English-speaking populations in Uganda and Norway.
Methods
Scope and setting
Most of the data collection took place in Uganda. The reason for this was that we intended to use the items from the Claim Evaluation Tools database as the primary outcome measure for the IHC trials there. The items in the Claim Evaluation Tools database are expected to work in the same way for children and adults.23 Consequently, for this evaluation, we needed a sample including both children and adults to explore item bias differential item functioning (DIF) associated with age. We also needed a mix of people with and without relevant training. For these purposes, we invited children (in year 5 of primary school, with a starting age of 10 years) and adults who had participated in piloting of the IHC resources. We also recruited children, parents and other adults (without training) through our networks in Uganda established at the start of the IHC project.26 27
We also included a group of children who had participated in a pilot of the IHC primary school resources at an international school in Norway. Although this was a small sample, it provided an indication of the fit to the Rasch model in an international population and provided information on difficulty and DIF in the two different settings.
Test administration and sample size
We evaluated 88 items addressing the 22 Key Concepts initially targeted by two IHC interventions.26 27 Having multiple items for each concept allows us to delete items with poor fit to the Rasch model. In addition, Rasch analysis provides information on each item’s difficulty. Having a range of items with different difficulties addressing each Key Concept can be useful for measurement purposes, for example when used in Computer Adaptive Testing.
There is no consensus on the sample size needed to perform a Rasch analysis.28 This is a pragmatic judgement that takes account of the number of items evaluated and the statistical power needed to identify item bias resulting from relevant background factors. Since we intended to test many items, we did not consider it feasible to include these in a single test and split the items into four sets or ‘tests’. We aimed to include approximately 250 respondents in Uganda for each of the four tests.
The children in Norway only responded to one set (out of the four). In both settings, we administered the items in English, since this was the official school language in both the Norwegian international school and the Ugandan schools. The data collection took place in 2015.
In developing the Claim Evaluation Tools database, low literacy skills were identified as a potential barrier in the Ugandan setting.23 Consequently, we developed four items to evaluate the respondents’ text recognition and understanding as an indication of their reading ability (see online supplementary appendix 1). We tested these items using the Lexile Analyser, and the items were found to fit within typical reading measures for fifth graders.29 We designed the items to resemble the multiple-choice items addressing the Key Concepts. The first two items required the respondents to identify the correct text in the scenario. The latter two items assessed whether the respondent understood the information in the scenario.
Supplemental material
Rasch analysis
Rasch analysis is used to check the degree to which scoring and summing-up across items is defensible in the data collected.30 31 It is a unified approach to address important measurement issues required for validating an outcome measure such as a scale or a test, including testing for: internal construct validity for multidimensionality, invariance of the items (item–person interaction) and item bias (DIF).31
Rasch analysis has been used successfully in many disciplines including health research and can be applied to both dichotomous and polytomous data.31–33 Rasch analysis also provides an excellent basis for developing and revising items and in construction of item banks. Misfit to the Rasch model might be diagnosed, and items can be deleted or revised to improve model fit.34 In this way, Rasch analysis represents a dynamic approach to achieving construct validity, in which revisions are informed by the evidence.34 For this analysis, we scored all items dichotomously. We used Excel for data entry, RUMM2030 for Rasch analysis and SPSS for a simple classical test theory approach to distractor analysis. We report the steps we took in our analysis below following the fundamental aspects of Rasch analysis.31
Summary statistics and overall fit
In Rasch analysis, the response patterns to an item set are tested against what is expected by the model, that is, the ratio between any two items should be constant across different ability groups.31 For this study, ability refers to the ‘ability to critically assess claims about treatment effects’. In other words, the easier the item is, the more likely it will be answered correctly, and the more able the person is, the more likely he or she will answer correctly.35 We explored this relationship between the expected and observed data using the summary statistics function in RUMM2030.
The overall Item–Person Interaction is presented on a logit scale, and in RUMM2030 the mean item location is always given as a zero. A mean person location higher than ‘0’ indicates that on average, the test is ‘too easy’ and that the response group has a higher ability than the difficult level of the test. A mean person location lower than ‘0’ suggests the test is ‘too hard’.
From this analysis, we also report the item and person Fit Residual Statistics; this assesses the degree of divergence (or residual) between the expected and observed data for each person and item when summed for all items and all persons, respectively. In RUMM2030, this is reported as an approximate z-score, representing a standardised normal distribution.36 Ideally, item fit and person fit should have a mean of zero and a SD of 1.31
The Item-Trait- Interaction in RUMM2030 is a test of invariance to the scale, and whether or not the data fit the model for the discreet ability groups.37 Ideally, the χ2 probability value should be greater than 0.05, indicating that there is no ‘statistically significant’ deviation between the observed data and what is expected form the model.
Power of test of fit and reliability
The Person-Separation Index is an indicator of the power of a set of items to discriminate between ability groups and individuals.36 We considered a Person-Separation Index greater than 0.7 to be acceptable.36 We also calculated Cronbach’s alpha as a measure of the reliability of each set of items. We considered a value of 0.7 or higher to be adequate for this. In RUMM2030, Cronbach’s alpha can only be estimated if there are no missing data. We solved this by coding missing responses as ‘incorrect’ responses.36
Individual person and item fit
We investigated individual person fit. Misfit violates the principles of the Guttman structure and may indicate different types of error, such as guessing.
The item characteristic curve indicates the theoretically expected probability of answering correctly as a function of ability on the latent trait scale (see figure 2 for an example of an item characteristic curve). We inspected item characteristic curves and used χ2 values as single item fit indices using a 0.05 as our significance level. Using Bonferroni adjustment, the significance level was adjusted (p=0.05/k) according to the number of k significance tests carried out (one for each item).
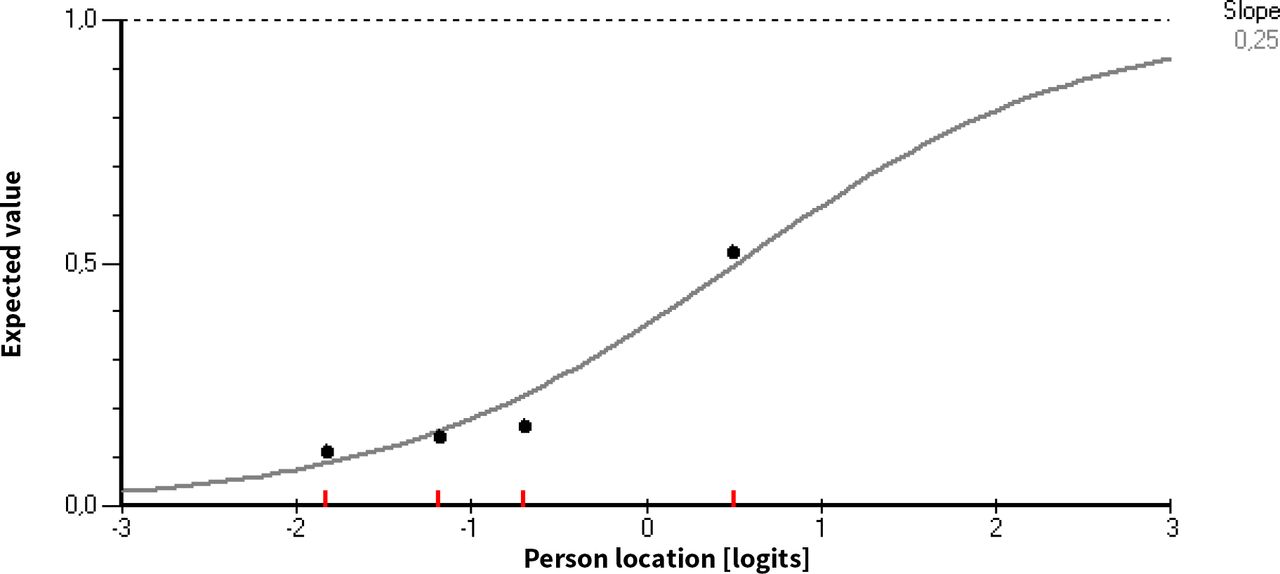
The item characteristic curve.
We also performed distractor analysis using SPSS. This is particularly useful when developing and revising multiple-choice items, because it may identify response options that are not working as intended and can subsequently be deleted or revised.
The curve in figure 2 represents the expected probability of answering correctly, and the dots represent the observed proportion of correct answers for some intervals of ability estimates (class intervals). When the observed proportions fit the curve, the data fit the Rasch model. Items with suboptimal fit indicate measurement error.36
When two groups of people (for example children and adults) respond differently to an item despite equal ability, that item displays ‘within item bias’ or DIF and invariance is violated.38 There are two types of DIF. Uniform DIF is when one group of people perform consistently better on an item; for example, when an item is easier for all adults across all ability groups compared with children. This is less problematic than non-uniform DIF, where the differences between the groups vary across levels of the attribute.31
We explored DIF for setting and age using analysis of variance in RUMM2030. We also explored DIF by reading ability. This was done by pragmatically categorising the responses to the four reading ability items into two groups (merging respondents with 0, 1 or 2 correct responses and those with 3 or 4 correct responses).
Testing for multidimensionality and response dependency
Unidimensionality—having just one trait underlying responses—is a fundamental requirement of measurement and is explored using Rasch analysis.35 Furthermore, there should be no response dependency in the data; that is, people’s responses to an item should not have a bearing on their responses to other items.39 Response dependence results in redundancy in the data and inefficient measures.
We explored possible dimension violations of local independence applying the principal components analysis/ t-test procedure computing paired t-tests using two subsets of items from each item set. The hypothesis of a unidimensional scale is weakened when the proportion of individuals with statistically significant differences in ability estimates on a pair of subscales exceeds 5%.40 We also inspected the residual correlation matrix estimated in RUMM2030.41 We considered residual correlations above 0.3 as indicators of response dependence between items.42
Results
Description of sample
The total sample included 1114 people, among whom 685 were children and 429 were adults (including 171 health professionals). Of these 1114 people, 329 had received some form of training related to the Key Concepts. The Norwegian sample equalled 5% (59 respondents) out of the total respondents. The mean number of missing and incorrectly filled in responses was <1% per item set. Less than 1/3 responded correctly to all four reading test questions in the Ugandan sample.
Summary statistics and overall fit
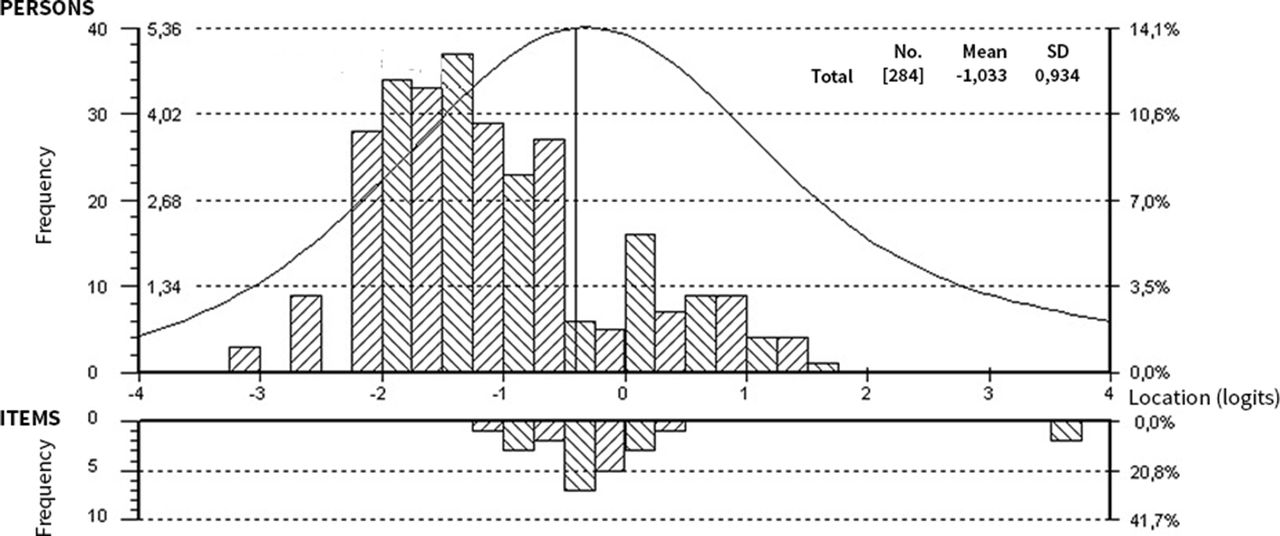
Overall, the items were difficult with no very easy items and no extremely difficult items (see figure 2 for the item threshold distributions per set). The mean person locations per set were −0.81, –1.06, −1.15 and −1.15 logits, respectively. Fit Statistics are presented in table 1. Mean item fit residuals and person fit residuals were satisfactory and close to 0, although the standard errors for set 1 and 2 is somewhat higher than what we would like to see. The Item–Person maps for all sets are available in figures 3–6. The upper part of the Item–Person map represents respondents’ ability levels; the lower part show the distribution of item locations. From this we can see that, overall, the tests are difficult. This suggests that easier items might be needed to make these tests more sensitive (able to separate between people at the lower end of the scale (those with lower ability).36 The χ2 probability was 0.00 for all sets, indicating that not all items may work as expected.

Item–Person map for item set 1.
Item–Person map for item set 2.

Item–Person map for item set 3.

Item–Person map for item set 4.
Overall fit statistics and tests of local independence by set
The estimated reliability indices were acceptable (Cronbach’s alpha >0.70 for all sets with exception of set 4 where the value was 0.63). Similarly, the Person-Separation Indexes were satisfactory for all sets with the exception of set 4, which had a value of 0.54.
Individual person and item fit
We identified few persons with misfit. Likewise, we identified only two items with potential misfit in set 1, and one item in the remaining three sets (see table 1).
Overall, most items fit well to the Rasch model. However, out of the 88 items, 17 items were found to have poor model fit. The findings resulting from the distractor analyses also suggested that many of the items would be improved by deleting or revising response options.
In set 1 (the only set applied in both Uganda and Norway), five items displayed uniform DIF and one item displayed non-uniform DIF associated with setting (ie, Norway and Uganda). Across the four sets including 88 items, six items displayed uniform DIF associated with age and seven items indicated DIF associated with reading ability.
Multidimensionality and response dependency
We did not observe any statistically significant residual correlation between pairs of items, and the paired t-test procedure indicated that the sets were sufficiently unidimensional (table 1).
Discussion
We have developed the Claim Evaluation Tools database using qualitative and quantitative feedback from methodologists and end-users in six countries.23 This study reports the findings of the first psychometric testing of multiple-choice items from the database, using Rasch analysis conducted in two settings—Uganda and Norway.
Most of the 88 items (addressing 22 Key Concepts) conformed well to the Rasch model. However, some items displayed DIF and required revisions. Overall, we found that the four item sets created from the Claim Evaluation Tools database had acceptable reliability. We did not identify significant response dependence between any pairs of items and, the magnitude of multidimensionality in the data was acceptable.
On the basis of the findings from previously reported descriptive and qualitative methods, experts and end-users suggested that the items were potentially difficult for members in our target group.23 The Rasch analyses confirmed this. Furthermore, using the reading items we developed, the respondents reading skills were found to be low. Using these items, we also explored DIF by reading ability. It should be noted that the results of this analysis should be interpreted with caution since these items have not previously been tested, and only served as a pragmatic indicator of the respondents’ ability to identify and apply the correct text in response to questions relating to a scenario similar to what we use in the multiple-choice items. Only 7 out of 88 items displayed evidence of DIF, suggesting that most items work in the same way independent of people’s reading ability as measured in this study.
This suggests that efforts should be made to simplify the text in the scenarios and editing the response options to improve readability and improve validity. Reducing the number of response options in the items could also contribute to making the items less difficult.
Based on the findings from our analyses, we decided to remove items with non-uniform DIF from the Claim Evaluation Tools database. We also decided to revise items with poor model fit and reduce response options that did not work as expected. Revised items will be retested in the Ugandan context, where they will be used as an outcome measure.
A limitation of this study is that we tested the items in only two settings, Uganda and Norway, and that the fit to the Rasch model in other settings is unknown. Further testing of items from the Claim Evaluation Tools database using Rasch analysis in other countries and languages is needed. We also did not include the respondents’ gender in the analysis, which could introduce further DIF. This will be explored in further testing.
There has been an encouraging interest in the Claim Evaluation Tools database in settings other than the countries included in the IHC project, and researchers in Norway, Mexico, Germany and China are currently translating and testing the multiple-choice items in their settings. In addition, the items addressing the Key Concepts we judged to be more advanced, and which were not tested as part of this study, are currently being tested online through www.testingtreatments.org, targeting people with relevant training, such as health researchers or teachers of evidence-based medicine. We are also developing items to assess intended behaviours and attitudes towards assessing treatment claims. The Claim Evaluation Tools database, which includes all of these questions, as well as findings from evaluations such as this one, is freely available for non-commercial use on request through the Testing Treatments interactive website (www.testingtreatments.org).
When used for evaluating peoples’ ability to assess treatment claims, an item set generated from the Claim Evaluation Tools database can be scored by calculating the number or percentage of correct responses. However, such scores can be difficult to interpret, especially when comparing the average score of two groups (eg, in a randomised trial). An absolute (criterion referenced) standard for a passing score (ie, a cut-off for passing) or for mastery of the Key Concepts that are tested. Setting a cut-off requires judgement, and there are several ways of doing this.43–45 For the items that will be used in the trials of the IHC primary school resources and podcast, we have established criteria-referenced standards using a combination of Nedelsky’s and Angoff’s methods.43–46
Conclusion
We found that most items that we tested had satisfactory fit to the Rasch model. Taken together with our previously reported findings, the findings of this study suggest that the items have face and construct validity in the settings in which they have been tested. Following revisions of some items, informed by the findings from this study, most of the items that we tested are suitable for use in an outcome measure that evaluates people’s ability to apply the key concepts they need to know to be able to assess treatment claims.
Acknowledgments
We are deeply grateful to all of the enthusiastic children, parents and teachers who contributed to this project. We would also like to thank the IHC advisory panel, and the other researchers and methodologists who provided their advice in the development process.
References
Footnotes
Contributors AA, ØG and AO wrote the protocol, and the IHC Group provided comments to this protocol. The Claim Evaluation Tools were developed by the IHC Group. AA coordinated all of the development and evaluation process with support from AO. DS, AN and KO performed the data collection and data entry from the field testing. ØG and AA prepared the data files for the analysis, and ØG conducted the Rasch analysis. AA authored this manuscript with significant input from the IHC Group.
Funding The IHC project is funded by the Research Council of Norway-GLOBVAC project 220603.
Competing interests None declared.
Ethics approval The research was approved by the Makerere University School of Medicine Research and Ethics Committee and the Uganda National Council for Science and Technology.
Provenance and peer review Not commissioned; externally peer reviewed.
Data sharing statement All data are published as part of this study; additional information is available upon request and on our website informedhealthchoices.org. All items in the Claim Evaluation Tools Database are available upon request for non-commercial use.