Article Text

Abstract
BACKGROUND Persisting controversy surrounds the use of transthoracic needle aspiration biopsy (TNAB) stemming from its uncertain diagnostic accuracy. A systematic review and meta-analysis was therefore conducted to evaluate the accuracy of TNAB for the diagnosis of solitary or multiple localised pulmonary lesions.
METHODS Searches for English literature papers in Index Medicus (1963–1965) and Medline (1966–1996) were performed and the bibliographies of the retrieved articles were systematically reviewed. Articles evaluating the accuracy of TNAB in series of consecutive patients presenting with solitary or multiple pulmonary lesions were considered. Only papers in which ⩾90% of patients were given a final diagnosis according to an appropriate reference standard were included in the meta-analysis.
RESULTS A total of 48 studies were included and five meta-analyses were conducted according to four diagnostic thresholds. From the pooled sensitivity and specificity corresponding to each diagnostic threshold, associated likelihood ratios (LRs) were derived for malignant disease as follows: (1) malignant versus all other categories, LR = 72; (2) malignant or suspicious versus all others, LR = 49; (3) suspicious versus all categories but malignant, LR = 15; (4) benign versus all others, LR = 0.07; and (5) specific benign diagnosis versus all others, LR = 0.005. Differences in methodological quality of the studies, needle types, or whether a cytopathologist participated in the procedure failed to explain the heterogeneity of the results found in almost every meta-analysis. Given a 50% probability of malignancy prior to the TNAB, post-test probabilities of malignancy upon receiving the results would be malignant, 99%; suspicious, 94%; non-specific benign, 7%; and benign with a specific diagnosis, 0.6%.
CONCLUSIONS Given the intermediate pre-test probabilities that would probably lead to performing TNAB, findings of “malignant” or of a specific diagnosis of a benign condition provide definitive results. Findings of “suspicious” markedly increase the probability of malignancy, and “benign” markedly decreases it but may not be considered definitive.
- coin lesion
- lung neoplasms
- needle biopsy
- diagnosis
- meta-analysis
Statistics from Altmetric.com
In 1995 American physicians investigated an estimated 150 000 patients who presented with a pulmonary nodule.1 Most often their primary goal was to establish or reject a diagnosis of malignancy. As many as 10–20% of bronchogenic carcinomas present initially as solitary pulmonary nodules.2 Causes of pulmonary nodules are nevertheless multiple and the proportion of lesions that prove benign varies widely in published series. Although an array of clinical characteristics may help to predict the malignant or benign nature of a pulmonary nodule,1 ,3 ,4 the final diagnosis most often relies on histopathology.
More than 30 years after the introduction of transthoracic needle aspiration biopsy (TNAB) by Nordenström,5 areas of controversy surrounding its use persist. Part of the controversy stems from the uncertain operating characteristics, especially for the diagnosis of benign pathological processes. Accordingly, guidelines regarding the indications for TNAB remain non-directive, and the American Thoracic Society recommends that “experience and sound clinical judgment . . . determine its use in individual cases”.6 In narrative overviews of the use of TNAB in localised pulmonary lesions, sensitivity of TNAB for the diagnosis of malignancy was reported to range from 64% to 100%.7 ,8Similarly, sensitivity of TNAB for the specific benign diagnosis was reported to range from 11.7% to 68%.7-10
Reappraisal of the usefulness of TNAB in the diagnosis of localised pulmonary lesions requires a better understanding of its accuracy. We therefore conducted a systematic review and meta-analysis with the following objectives: (1) to determine the operating characteristics of TNAB for the diagnosis of malignancy presenting as localised solitary or multiple parenchymal lesions; and (2) to identify characteristics of the TNAB technique that influence the diagnostic performance of the test.
Methods
LITERATURE SEARCH
We searched Medline on CD-ROM (1966–96) for original articles published in the English language medical literature using the following strategy: {lung neoplasms and needle biopsy} or {coin lesion/diagnosis} (exploding all terms). Since Nordenström introduced TNAB as it is performed today in 1963,5 we restricted our Index Medicus search to the 1963–5 period using the following headings: (1) “biopsy” (“needle biopsy” could not be used as a heading since it was introduced in Index Medicus only in 1973); (2) “coin lesion, pulmonary” (introduced in Index Medicus only in 1965); and (3) “lung neoplasms”. We searched for additional articles from the reference lists of relevant articles.
STUDY SELECTION
The following criteria guided us in selecting studies for inclusion.
Target population
Studies were eligible if they assessed a series of consecutive patients presenting with parenchymal pulmonary solitary or multiple localised lesions. Articles reporting on heterogeneous populations of patients with mediastinal, hilar, pleural and/or pulmonary lesions were included only if ⩾90% of the patients had parenchymal lesions, unless the subgroups of patients were reported separately.
Diagnostic intervention: TNAB
We considered papers reporting on the following categories of needles11 ,12: (1) aspiration needles (Chiba and Zavala types); (2) small gauge biopsy needles (fig 1); and (3) cutting needles. Reports on aspiration biopsies performed with any type of radiological guidance (fluoroscopic, ultrasonography, or computed tomography) were also eligible.

Aspiration biopsy needles. Reproduced from Lieberman et al12 with permission.
Reference standard
We regarded resection specimen, biopsy procedures of an adjacent site with tumour involvement (such as mediastinoscopy), long term follow up, and culture results as appropriate reference standards. However, a concomitant clinical diagnosis and finding of typical malignant cells on TNAB were not regarded as an acceptable reference standard. We required that at least 90% of the patients in the study cohort had had their TNAB result verified by the reference standard.
Report of diagnostic accuracy
The minimum requirement was that the data permitted construction of a 2 × 2 table allowing the computation of the operating characteristics (sensitivity and specificity) of TNAB for the diagnosis of malignancy. We also included papers in which the operating characteristics of TNAB were derived from either the number of patients receiving the procedure or the number of procedures per se.
Two reviewers (YL and EW) successively applied these criteria to the titles and abstracts of all citations obtained. The reviewers were blinded to authors’ names, journal, and year of publication of the papers retrieved from Medline. If the title of an article or, when available, its abstract suggested any possibility that it might be relevant, the paper was retrieved and included in a “study list”. Finally, the same reviewers independently assessed the full article for a final decision about its inclusion into the meta-analysis. Any disagreement was resolved by consensus or by consulting a third reviewer (GHG). The same process was applied to the references retrieved through Index Medicus and by reviewing the reference lists of the relevant papers. We attempted to contact the authors of the articles containing insufficient information or data to decide upon their inclusion in the meta-analysis. In instances in which investigators published several reports on the same patients, we considered only the article reporting on the largest number of patients. Agreement between coders was measured using quadratic weighted kappa statistics.13 A log of reasons for rejection of citations identified from the searches was kept.
STUDY EVALUATION FOR METHODOLOGICAL QUALITY
We evaluated study validity by systematically considering each of the potential sources of bias from existing recommendations14 ,15 which identify important potential weaknesses of diagnostic test studies. Three important biases were considered: (1) the “work up” bias which is introduced by excluding patients from the analysis because they were not submitted to the reference standard procedure; (2) the “review” bias which is introduced when the test result was not verified by the reference standard procedure; and (3) the “test review” bias which is introduced when the observers are aware of either the clinical condition of the patient or the final diagnosis. We considered the first two biases as crucial and therefore used them as exclusion criteria of the primary studies in the meta-analysis. For instance, we minimised the chance of work up bias by including only series of consecutive patients. In doing so, we also ascertained that the patient sample included an appropriate spectrum of patients to whom the diagnostic test was applied.14 Similarly, we limited the threat of the review bias by requiring that at least 90% of the patients in the study cohort had their TNAB result verified by the reference standard. Two remaining validity criteria were applied: (1) whether an independent blind comparison with the reference standard was performed, which limits the test review bias; and (2) whether the evaluation was prospective or retrospective.14
EXTRACTION OF INFORMATION
Two reviewers (YL and EW) abstracted information from all papers selected for inclusion in the meta-analysis. The abstracted information included: (1) the distribution of diagnoses in groups of patients with malignant and benign diseases; (2) the size of the pulmonary lesions; (3) the location of the lesions (central (hilar and perihilar lesions) versus peripheral (lesion within lung substance)); (4) the type of needle; (5) the type of radiological assistance; (6) whether a cytopathologist was consulted during the procedure; (7) the reference standard used by the investigators including the number of patients who were given a final diagnosis by either method; (8) the type and number of complications (pneumothorax and bleeding) associated with the biopsy; and (9) the final results related to the accuracy of the test. Any disagreement regarding the abstracted information was resolved by consensus. When information was missing in the original publication, the corresponding author received a request to clarify the issue and, if no reply was received within eight weeks, a reminder letter was sent.
STATISTICAL ANALYSIS
Contingency tables
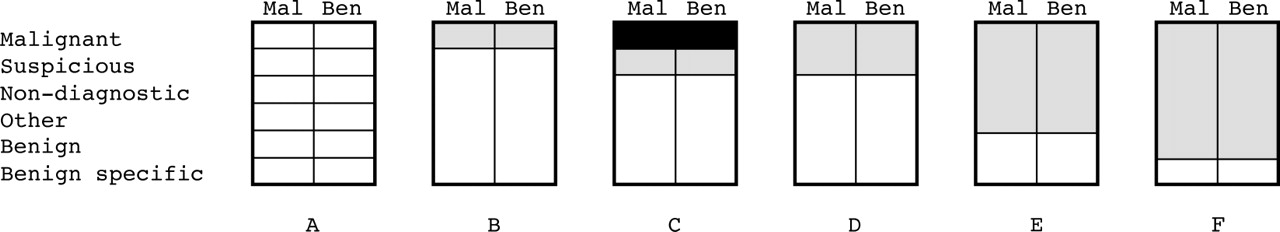
For each study we constructed a 6 × 2 contingency table according to the six following categories (fig 2): (1) positive for malignancy, (2) suspicious for malignancy, (3) anything other than malignant; (4) non-diagnostic, (5) benign but non-specific, and (6) specific benign diagnosis. Each patient was classified as having a “malignant disease” or a “benign disease”. We defined the “specific benign diagnosis” category as the ability of TNAB to give, for instance, a diagnosis of “hamartoma” or “tuberculosis” when hamartoma or tuberculosis are present. We considered reports of “inflammatory cells” or “benign disease” as non-specific. For studies reporting on less than five diagnostic categories—for example, malignant versus non-malignant or malignant versus non-diagnostic versus benign—the contingency table was filled in according to the selected categories.

Contingency tables constructed for the data analysis. Mal = malignant; Ben = benign. (A) For each study a 6 × 2 contingency table was constructed according to the six following categories: (1) positive for malignancy, (2) suspicious for malignancy, (3) anything other than malignant; (4) non-diagnostic, (5) benign but non-specific, and (6) specific benign diagnosis. Each patient was classified as having a “malignant disease” or a “benign disease”. All six categories were not necessarily considered in the primary studies. The lack of standardised categorical scale to report the results of TNAB led us to summarise the operating characteristics of TNAB in terms of sensitivity (true positive rate) and specificity (true negative rate) using different diagnostic thresholds between “positive” and “negative” results. The thresholds most likely to have the same meaning were selected across studies (panels B–F). (B) Malignant versus all other categories: 2 × 2 table constructed by considering “malignant” as a positive result and by collapsing the data from the remaining five categories as negative. (C) Suspicious versus all other categories (excluding the “malignant” category): 2 × 2 table constructed by considering “suspicious” as the only positive result and by collapsing the remaining four categories as negative. (D) Malignant or suspicious versus all other categories: 2 × 2 table constructed by collapsing the “malignant” and “suspicious” categories as a positive result and by collapsing the remaining four categories as negative. (E) Benign versus all other categories: 2 × 2 table constructed by collapsing the “benign” and “benign specific” categories as a negative result and by collapsing the remaining four categories as positive. (F) Benign specific versus all other categories: 2 × 2 table constructed by considering “benign specific” as a negative result and by collapsing the remaining five categories as positive.
Pooled sensitivity and specificity
We would have liked to summarise the operating characteristics of TNAB in terms of result-specific likelihood ratios. This approach to reporting diagnostic test accuracy is preferred over the concepts of sensitivity and specificity when the test results are measured as responses on an ordinal categorical scale rather than a dichotomous scale.16 The lack of standardised categorical scale to report the results of TNAB and our suspicion that investigators had used different diagnostic thresholds across studies led us to abandon this statistical approach. We therefore elected to summarise the operating characteristics of TNAB in terms of sensitivity (true positive rate) and specificity (true negative rate) using diagnostic thresholds between “positive” and “negative” results most likely to have the same meaning across studies.
Five meta-analyses were conducted using the following thresholds (fig2): (1) malignant versus all other categories; (2) malignant or suspicious versus all other categories; (3) suspicious versus all other categories (excluding the “malignant” category); (4) benign versus all other categories; and (5) specific benign versus all other categories. We calculated sensitivity and specificity weighted by the inverse of the estimate variance and pooled by the methods described by Hasselblad and Hedges17 according to a random effects model. This model assumes that the studies included in the meta-analysis are a random sample from a larger population of studies (to include uncovered, uncompleted, or planned studies) and that the estimate of the operating characteristic obtained in each study differs from the population operating characteristic because of sampling error.18
Test of homogeneity
Although the random effects model takes into account potential heterogeneity among study results, we also tested for homogeneity in order to disclose it and to investigate its potential sources. We plotted receiver operating characteristic (ROC) curves (a plot of sensitivity versus specificity of individual studies) to examine visually whether heterogeneity existed among study results. We then tested for homogeneity among study results for both sensitivity and specificity using a χ2 test with n—1 degrees of freedom where “n” was the number of studies contributing to the analysis.19 The interpretation that differences in study results are consistent with random variation was adopted if the test of homogeneity resulted in a p value of >0.05.
Bayesian data interpretation: estimate of the likelihood ratios
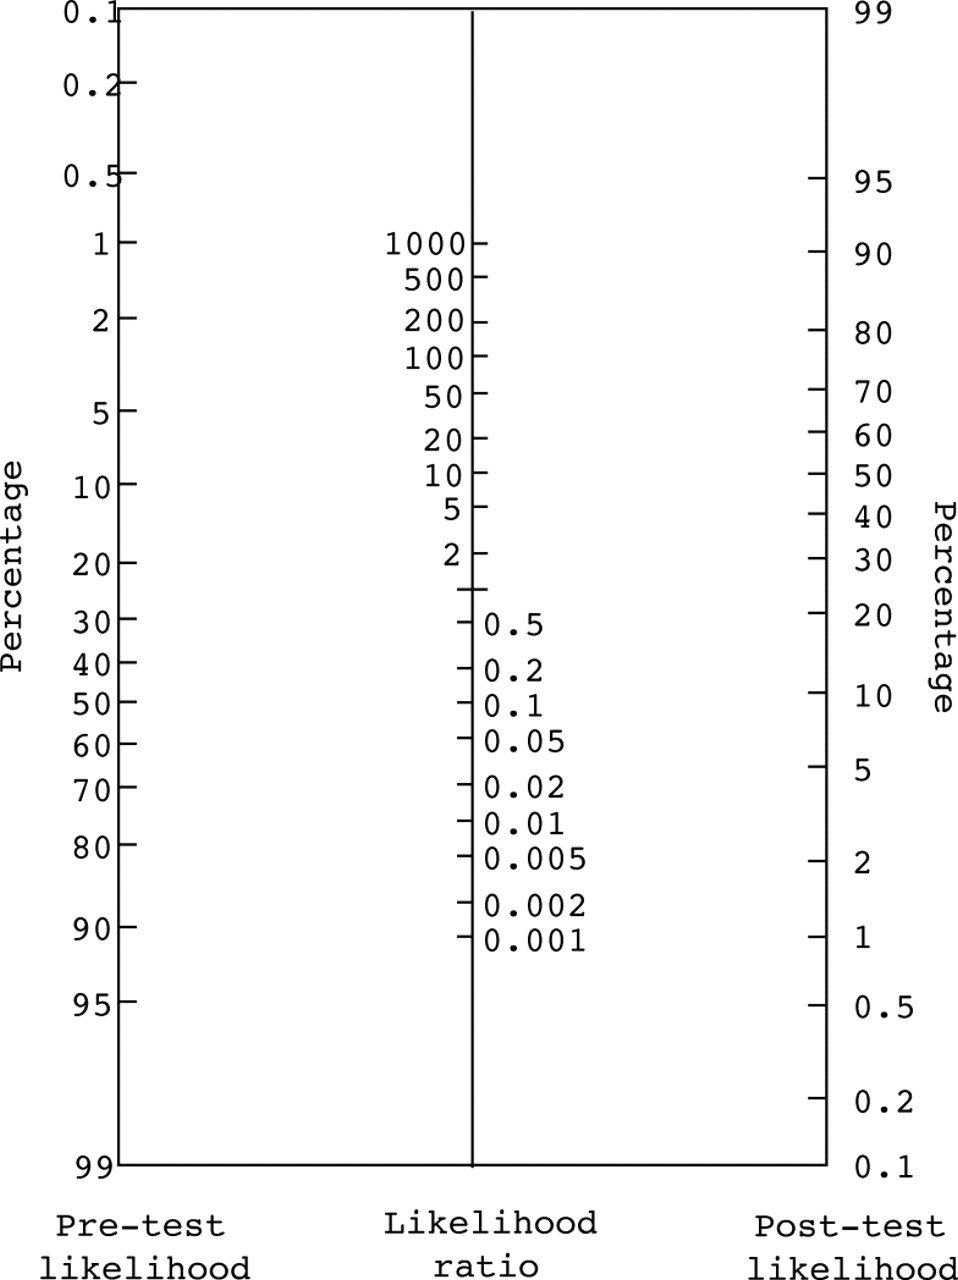
Finally, from the pooled sensitivity and specificity we estimated the corresponding likelihood ratio (true positive rate/false positive rate or sensitivity/(1—specificity)) which indicated by how much a given test result raises or lowers the pretest probability of the target disorder. For instance, a likelihood ratio of 10 means that a positive test result is 10 times as likely to occur in a patient having the disease under study. A likelihood ratio of 1 does not change the probability of the target disorder. Likelihood ratios of less than 1 decrease the probability of the target condition—the smaller the likelihood ratio, the greater the decrease in probability.20 Thus, given a pre-test probability determined on the basis of the history and other non-invasive test results, the likelihood ratio of the test result allows us to calculate the post-test probability according to the Bayes’ theorem or by simply using the nomogram proposed by Fagan (fig 3).21 This is shown diagrammatically in fig 4.

Nomogram for interpreting diagnostic test results. Adapted from Fagan.21

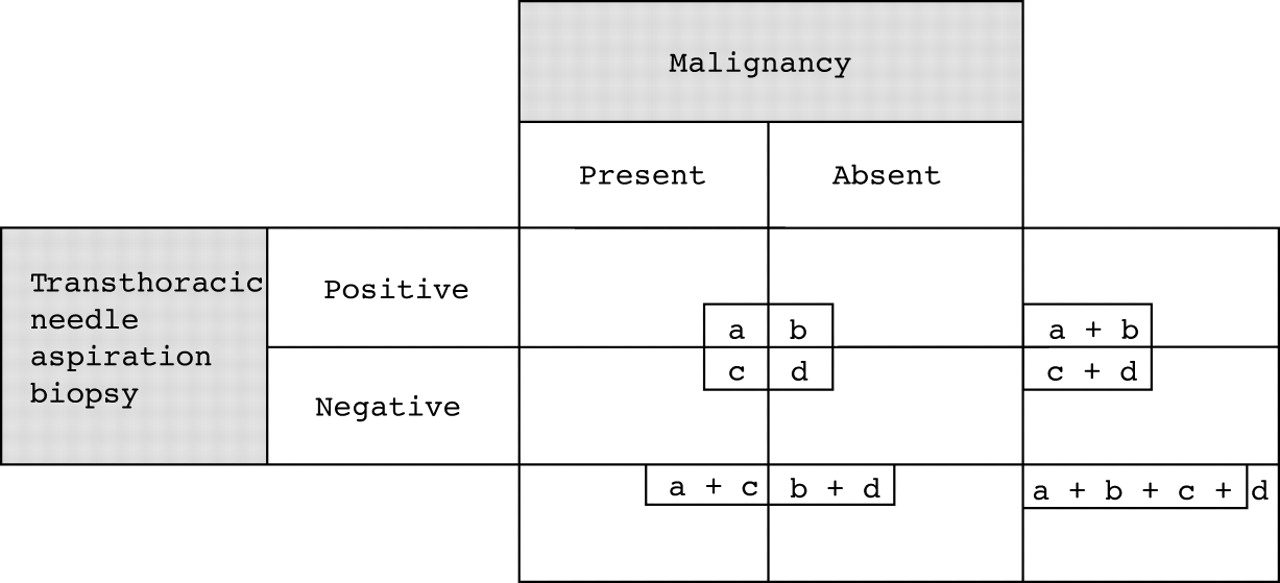
Operating characteristics of a diagnostic test. a/(a + c) = sensitivity; d/(b + d) = specificity; [a/(a + c)]/[b/(b + d)] = sensitivity/(1 − specificity) = likelihood ratio (of having malignancy) for a positive test result; [c/(a + c)]/[d/(b + d)] = (1 − sensitivity)/specificity = likelihood ratio (of having malignancy) for a negative test result. Adapted from Sackett et al.20
Subgroup analyses
In outcomes that did not meet the criteria for homogeneity, we conducted subgroup analyses in an effort to identify the source of heterogeneity. The finding of both homogeneity within subgroups and statistically significant differences between subgroups were needed to declare heterogeneity among studies as satisfactorily explained by the analysis.
Complications of TNAB
We restricted the analysis of complications to the incidence rate of pneumothoraces requiring or not requiring chest tube drainage. The incidence of bleeding was excluded from the analysis since, early in our review of the original studies, we found that the term “bleeding” was most often poorly defined and apparently included a wide spectrum of severity from minor haemoptyses to massive bleeding. The proportions were pooled according to the same method as previously described.17 We tested the homogeneity among study results using a χ2 test. If the results were heterogeneous we conducted subgroup analysis according to the same a priori hypotheses as those developed to explain heterogeneity in sensitivities or specificities of TNAB.
A PRIORI HYPOTHESES EXPLAINING HETEROGENEITY AMONG STUDIES
To explain potential heterogeneity among studies we made several a priori hypotheses concerning underlying differences. Firstly, we hypothesised that prospective studies using an independent blind comparison with a reference standard are likely to give systematically different results.14 Secondly, the larger the mean size of the lesions, the more accurate the test is likely to be because large lesions tend to be more peripheral and easily accessible.22 Thirdly, computed tomographic or ultrasonically guided TNAB are likely to have a different diagnostic accuracy from fluoroscopically guided TNAB.22 However, the real effect of new radiological guidance techniques is not necessarily toward an improvement in the overall diagnostic accuracy since patients benefiting from these techniques may be selected because they have lesions which are difficult to biopsy. Fourthly, we hypothesised that the larger the needle, the more accurate is the test.23Fifthly, immediate consultation with a cytopathologist may enhance accuracy of the test because repeated passes may be performed within the same procedure.24 ,25 Finally, in reviewing the primary studies we noted that some authors reported the operating characteristics of the tests according to the total number of patients submitted to the procedure, whereas others did so according to the total number of biopsies performed. We hypothesised that the former statistical method may be a source of bias, especially when several patients had undergone biopsies more than once. For instance, 100 patients with malignant diseases may be submitted to a total of 150 biopsies before obtaining adequate material to arrive at the correct diagnosis of malignancy in 90 of them. If the true positive rate is defined according to the number of patients (number of malignancies diagnosed/total number of patients) then the true positive rate is 90/100 (90%). However, if the true positive rate is defined according to the number of biopsies (number of malignancies diagnosed/total number of biopsies performed in patients with malignancy) then the estimate is 90/150 (60%). To appreciate the magnitude of the bias introduced by such reports we also calculated the ratio between the number of procedures and the number of patients. In the above example this ratio would be 1.5:1 (150 procedures in 100 patients). The larger this ratio, the larger the magnitude of the bias potentially introduced by such a method of reporting.
Results
LITERATURE SEARCH/AGREEMENT STUDIES
From the 847 titles obtained from Medline and the 1746 references listed in Index Medicus, 284 were retained for further assessment. The review of the reference list of these papers yielded 57 additional articles not previously identified. A study list of 341 (284 + 57) papers was hence constructed. This list is available from the authors upon request. Forty eight studies reported in 47 papers were finally included in the meta-analysis.23 ,26-71 Two articles reported on two independent studies34 ,35 and two papers reported on the same study.68 ,69 A summary of these 48 studies is shown in table 1. The agreement between the two primary reviewers regarding the inclusion of the studies in the meta-analysis was moderate (weighted kappa = 0.42; 95% confidence interval 0.35 to 0.50). The reasons for excluding 295 papers were as follows: 137 studies did not properly compare the result of the TNAB with any reference standard; 77 studies did not distinguish patients with mediastinal or pleural lesions from those with parenchymal pulmonary lesions; 41 papers were case reports or series; 17 were review papers; 10 reported on cytological diagnosis of lung lesions without specific reference to TNAB; and 13 were excluded for miscellaneous reasons. We requested missing information from the authors of all the studies included in the overview and achieved a response rate of 85% (39/46).
Summary of the studies included in the meta-analysis
VALIDITY ASSESSMENT
In seven of the 48 studies (15%) the cytopathologist was unaware of either the clinical condition of the patient or the final diagnosis. Fifteen studies (31%) were prospective (table 1). Only two studies (4%) satisfied both validity criteria.28 ,45 In 13 studies (27%) the authors elected to report the results according to the numbers of patients (and not according to the number of biopsies). In these studies the ratio of procedures to patients was <1.1 in eight studies and reached 1.29 in one study.
OPERATING CHARACTERISTICS OF TNAB
Malignant versus all other categories
All 48 studies contributed to this analysis (table 2, fig 5). TNAB was found to be moderately sensitive but highly specific for the diagnosis of malignancies. These results corresponded to a likelihood ratio of 72. In the circumstances of an intermediate pre-test probability of malignancy, a diagnosis of “malignancy” obtained from TNAB therefore usually results in a conclusive change from pre-test to post-test probability of malignancy. For instance, for pre-test probabilities of 0.33 or more the post-test probability is greater than 97%. However, we found heterogeneity among studies in their true positive rates (sensitivities). Of the six a priori hypotheses we developed to explain heterogeneity, none could satisfactorily explain it. The one supposing that the larger the lesions, the more accurate the TNAB could not be used since only eight studies27 ,28 ,30 ,32 ,37 ,42 ,45 ,63 reported on the mean size of the lesions, which ranged from 2.0 to 4.7 cm. We found statistically significant differences in sensitivities in three subgroup analyses: (1) as expected, sensitivity of TNAB was lower in the studies in which the investigators blindly compared the results of TNAB with the reference standard than in those in which unblinded comparisons were done (sensitivity and likelihood ratios 89.5% and 75 versus 78.3% and 65, respectively; difference p<0.001); (2) contrary to what we anticipated, aspiration biopsy needles yielded better results than cutting needles; and (3) fluoroscopy guided TNAB was slightly less sensitive than TNAB performed under any other radiological guidance. However, heterogeneity remained within all subgroups.
Primary results of the meta-analyses

Receiver-operator characteristic (ROC) curves: plots of sensitivity versus (1 − specificity) of individual studies according to five diagnostic thresholds. (A) Malignant versus all other categories; (B) malignant or suspicious versus all other categories; (C) suspicious versus all other categories (excluding the “malignant” category); (D) benign versus all other categories; (E) benign specific versus all other categories.
Suspicious versus all other categories (with or without the “malignant” category)
Inclusion of the pathologist’s diagnosis of “suspicious” lesions in the malignant category slightly increased its sensitivity but decreased its specificity. However, these changes were associated with a significant reduction in the corresponding likelihood ratio. Again, we found heterogeneity in the study sensitivities. The subgroup analyses also failed to explain this heterogeneity satisfactorily.
We isolated the “suspicious” category by excluding from the analysis the “malignant” category (fig 2, panel C). We acknowledge that such a manoeuvre introduces an additional source of error, the “suspicious” category being affected by two diagnostic thresholds (malignant versus suspicious versus everything else). Accordingly, it is not surprising that we again found heterogeneity in sensitivity among the 21 studies that contributed to this analysis which we could not explain. The estimated likelihood ratio associated with the “suspicious” category was 15.
Benign versus all other categories
Thirty five studies contributed to this meta-analysis; 81.0% (95% CI 74.7 to 87.3) of the benign lesions were identified as such by TNAB. The corresponding likelihood ratio was 0.07. A “benign” diagnosis obtained from TNAB could bring the post-test probability of malignancy to a value sufficiently small to confidently conclude the absence of malignancy (post-test probability <5%) when the pre-test probability of malignancy is less than 50%.
Benign specific versus all other categories
Only 20 of the 48 studies contributed to this analysis. The likelihood ratio associated with the “benign and specific” category was 0.005. Although this diagnosis could generate a conclusive change from pre-test to post-test probability of malignancy even when the pre-test probability of malignancy is high, it was obtained in only 44% of the benign lesions which limits its clinical usefulness. Significant heterogeneity was found among study results for both sensitivity and specificity and was not resolved by any of our a priori hypotheses.
COMPLICATION RATE OF TNAB
The incidence of pneumothorax was reported in 36 studies and ranged from 3.1%30 to 41.7%66 (pooled incidence rate 24.5%; 95% CI 21.1 to 27.9; test of homogeneity p = 0.001), whereas the incidence of pneumothorax requiring chest tube drainage was reported in 39 studies and ranged from 0%30to 16.6%31 (pooled incidence rate 6.8%; 95% CI 5.5 to 8.1; test of homogeneity p = 0.001). None of the a priori hypotheses we developed satisfactorily explained heterogeneity among study results. The use of a cutting needle was not clearly associated with a higher risk of pneumothorax.
Discussion
The interpretation of any test result begins by an estimate of the pre-test probability of the target condition which, in most cases of localised pulmonary lesions, is any type of malignancy. The clinician determines the pre-test probability on the basis of the history and other non-invasive radiographic procedures and can then use the likelihood ratio associated with the biopsy test result to determine the post-test probability. While Bayes’ theorem allows a simple computation of the post-test probability, most clinicians will find it much easier to use the nomogram proposed by Fagan (fig 3). Data from a systematic literature review by Gurney4 help with estimation of the pre-test probability. Swensen et al 1 have used these data to calculate the probability of cancer in patients presenting with solitary pulmonary nodules (table 3). In this retrospective cohort study conducted at the Mayo Clinic patients with a newly discovered 4–30 mm nodule on a conventional chest radiograph were included. The authors defined “solitary pulmonary nodule” as a solitary, round, or oval lesion in the lung parenchyma on a chest radiograph in the absence of adenopathy, atelectasis, or pneumonia. The nodules were indeterminate radiographically, with no evidence of benign pattern calcification on thin section computed tomography. Patients who were diagnosed as having any cancer within the past five years were excluded. No patients with a history of primary lung cancer were included. The investigators derived a clinical prediction model that yielded an equation expressing the probability of malignancy as a function of statistically significant predictors from a multivariable logistic regression. This type of analysis removes the effect of the prevalence of malignancy in the study population on the probability of malignancy, so that resulting probabilities can be applied to other populations.
Probability of malignancy (p value)3-150
For instance, let us consider a 55 year old non-smoking woman who presents with a 10 mm spiculated nodule located in the right upper lobe. Her past medical history includes a mastectomy for breast cancer six years previously. From table 3 the pre-test probability of malignancy is 44%. A TNAB is performed and a diagnosis of “malignancy” is obtained, which corresponds from the meta-analysis to a likelihood ratio of 72. From the nomogram of Fagan the post-test probability of malignancy reaches more than 98%. Had the pathologist responded “suspicious for malignancy” the post-test probability would have been around 92%. On the other hand, if the pathologist had diagnosed a “benign” lesion without being more specific, the post-test probability of malignancy is 5%. Finally, had the pathologist reported a finding of “hamartoma” the post-test probability of malignancy would have been less than 1%.
We restricted this analysis to studies that met methodological criteria for assessing diagnostic procedures. From more than 2500 articles screened, only 48 met our inclusion criteria. Critical appraisal of the studies included in this review revealed several limitations important to the design of rigorous diagnostic test studies. For instance, only two were prospective studies using a blind comparison with a reference standard.28 ,45 The limited inter-rater agreement regarding the inclusion of the studies in this meta-analysis also reflects the often ambiguous and inconsistent reporting of study methods which made assessments of suitability for this review challenging. Ideally, diagnostic test studies should be as rigorous in design and reporting as is now expected of randomised controlled trials.72
One of the challenges in conducting this systematic review was summarising the results of individual studies into a contingency table. Whereas a number of studies reported the final results of the TNAB as a dichotomous variable (malignant versus non-malignant), others used sophisticated categorical scales. Our review highlights the need to develop a standardised method of reporting the results of TNAB.
Another finding of this meta-analysis is the heterogeneity among the results of the primary studies and the failure of the a priori hypotheses to explain it satisfactorily. TNAB is a complex multi-step procedure involving the technical skills of those who perform the biopsy, as well as the ability of the cytopathologists to recognise different patterns of cellular and/or histological abnormalities. Differences in skill and/or experience may explain the underlying heterogeneity of the study results. We proceeded with a meta-analysis despite the presence of heterogeneity because, short of a detailed study of the test properties in their own institutions, our likelihood ratios still provide the best guide to clinicians in their interpretation of TNAB results.
The recent statement by the American Thoracic Society and the European Respiratory Society on the pretreatment evaluation of non-small cell lung cancer which was endorsed by the American College of Chest Physicians73 supports the use of TNAB as the procedure of choice in patients in whom the benign nature of the solitary pulmonary nodule cannot be established by clinical criteria and in whom surgery (exploratory thoracotomy or video assisted thoracoscopic surgery) cannot be undertaken. TNAB prevents surgical intervention only if it establishes a benign diagnosis. Our finding of extreme likelihood ratios associated with TNAB results supports its use. At the same time, the finding of a benign and specific diagnosis is unusual, and this limits the usefulness of the test. Although recent studies indicated the added value of cutting biopsies by providing histological samples in the provision of a specific benign diagnosis,74 this meta-analysis of high quality studies published before 1997 did not demonstrate a clear advantage of cutting needles over aspiration and biopsy needles.
The recent introduction of positron emission tomography (PET) scanning further complicates the integration of TNAB in the diagnostic algorithm of localised pulmonary lesions. Several studies have reported high sensitivity and specificity of this new technology in the detection of malignant solitary pulmonary nodules.75 A recent head-to-head comparison between TNAB and PET scanning76suggested that PET imaging of the lung is as accurate as TNAB in the evaluation of lung lesions suspected to be malignant. However, this study did not meet the inclusion criteria of our meta-analysis for methodological reasons.
The results of a TNAB must be interpreted in the light of an estimate of pre-test probability of malignancy. Although the likelihood ratios corresponding to the “malignant” and “benign and specific” will generate definitive results, other findings may not. The heterogeneity of our results suggests that local studies would be highly desirable to appreciate the operating characteristics of the test within institutions better. Interobserver agreement, technical aspects of the biopsy, clinical indications, and cost analysis are also important issues that remain to be addressed.
Acknowledgments
We acknowledge the authors of the primary studies included in the meta-analysis who kindly provided additional data and information regarding their previous work. We also thank Mr Gaétan Daigle from the Laval University statistical consultation service for his assistance in the analysis.
References
Footnotes
Source of funding: none.